New England Results of the 2011 National Air Toxics Assessment
- Region 1 Administrator's Letter to the Public Regarding 2011 NATA (pdf)
- New England Short Summary of 2011 National Air Toxics Assessment (pdf)
- What is Being Done to Reduce Air Toxics?
- What Do We Know About Air Toxics Trends in New England in the Ambient Air?
Background
In December of 2015, EPA released the results of the 2011 National Air Toxics Assessment (NATA). EPA utilized its air emission inventory complemented with state data to model ambient concentration estimates for 180 hazardous air pollutants, plus diesel particulate matter. In this assessment, EPA estimated people's exposure to air toxics to characterize public health risks.
Coordination with States and Tribes
EPA Region 1 coordinated with the states, tribal governments and the Northeast States for Coordinated Air Use Management (NESCAUM) Air Toxics and Public Health Subcommittee to review the results of NATA and quality assure the data prior to releasing the data to the public. The results of the NATA are dependent on this close, cooperative interaction to develop and refine the 2011 air toxics inventory.
Key Findings in New England
Air Toxics of Greatest Concern in New England
- State average risk values of four air toxics: acetaldehyde, benzene, carbon tetrachloride, and formaldehyde exceeded health benchmarks in every state in New England, and state average risk values of three air toxics: 1,3-butadiene, acrolein, and naphthalene exceeded health benchmarks in at least one state in New England.
- Although there is no established cancer health benchmark for diesel particulate matter, people are exposed to high concentrations of diesel particulate matter so it is also an air toxic of concern.
- Mobile sources represent a significant emission category for benzene, 1,3-butadiene, diesel particulate matter, acrolein and naphthalene.
- Residential wood combustion sources represent a significant emission category for 1,3-butadiene, acrolein, benzene, and naphthalene.
- Background sources, including natural sources, emissions of persistent air toxics that occurred in prior years, and long-range transport, account for the majority of ambient air concentration estimates for carbon tetrachloride, a persistent, globally ubiquitous pollutant.
- Atmospheric transformation accounts for the majority of the risk estimates for acetaldehyde and formaldehyde, although mobile sources and residential wood combustion represent significant emission categories of anthropogenic emissions for these pollutants.
There are six other air toxic pollutants: asbestos, dioxin, lead, mercury, PCBs and radon, that are also a concern due to other routes of exposure or exposure from indoor sources and these continue to be a focus of our actions.
The following Table includes information on the emissions sources, and health effects for the air toxics of greatest concern in New England.
| Pollutant | Health Effects | Sources in New England |
|---|---|---|
| Acetaldehyde | Health Effects (pdf) | Summary (pdf) |
| Acrolein | Health Effects (pdf) | Summary (pdf) |
| 1,3-Butadiene | Health Effects (pdf) | Summary (pdf) |
| Benzene | Health Effects (pdf) | Summary (pdf) |
| Carbon Tetrachloride | Health Effects (pdf) | |
| Diesel particulate matter | Health Effects | Summary (pdf) |
| Formaldehyde | Health Effects (pdf) | Summary (pdf) |
| Naphthalene | Health Effects (pdf) | Summary (pdf) |
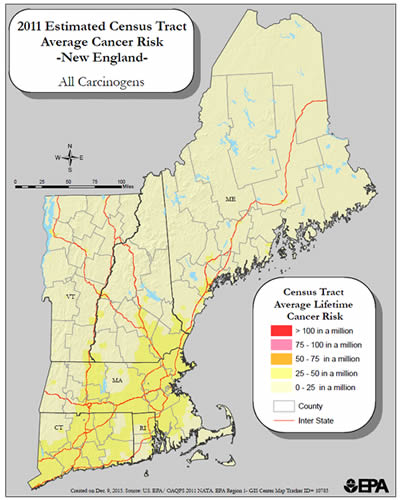
Summation of Carcinogenic Risk Estimate Map of New England
The following map represents a summation of carcinogenic risk estimates in New England for inhalation exposure to 80 air toxics modeled in the 2011 National Scale Air Toxic Assessment. The risk estimates in the map are based on the census tract level average of a typical individual's exposure.
The following limitations to these carcinogenic risk estimates for exposure to these air toxics must be noted: the inhalation route of exposure is the only exposure route that has been evaluated, only inventoried outdoor air toxic sources were used in this assessment since there isn't adequate data on indoor air exposures, and the risks associated with each carcinogenic pollutant are only added together since there is inadequate information on other health effect interactions.
These carcinogenic risk estimates can not be related to an individual's risk of cancer because the estimates are restricted to 2011 estimates and the results should be reviewed across broad geographic areas such as counties and states. These risk estimate maps should not be used to obtain information on specific types of cancers or possible cancer clusters but they can provide EPA, the states and the public with information on whether we're focusing on the right pollutants and sources to protect the public health.
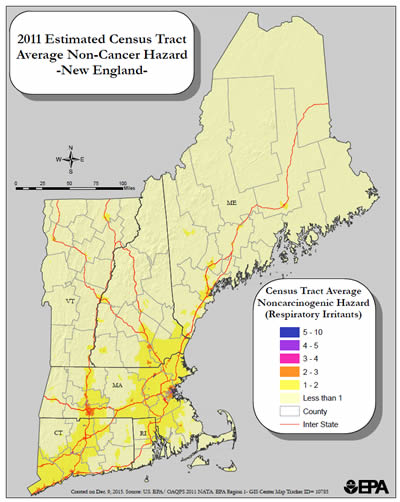
Summation of Noncancer Risks Map of New England
The following map represents a summation of hazard quotients that are used to provide a quantification of risks associated with noncarcinogenic chronic health effects for respiratory irritants in New England. A hazard quotient for a pollutant that is less than 1 indicates that no adverse health effects are expected as a result of exposure. If the hazard quotient is greater than 1, then adverse health effects are possible. The hazard index represented in the following map is a sum of all of the hazard quotients for the respiratory target organ system, with 43 air toxics evaluated as respiratory irritants. The risk estimates in the map are based on the census tract level average of a typical individual's exposure.
The following limitations to these chronic risk estimates must be noted: the inhalation route of exposure is the only exposure route that has been evaluated and only inventoried outdoor air toxic sources were used in this assessment since there isn't adequate data on indoor air emissions.
For more information about air toxics in New England, please contact:
Susan Lancey ([email protected])
For general information about other EPA programs, contact:
The EPA New England call center at (617) 918-1111


