Highlights of the Automotive Trends Report
On this page:
- Average new vehicle CO2 emissions and fuel economy continue to improve, aided by growing production of electric vehicles.
- Manufacturers are applying a wide array of electrification technologies.
- Overall CO2 emissions and fuel economy trends have been impacted by both technology improvements and market shifts.
- Average new vehicle fuel economy, horsepower, weight, and footprint are all increasing.
- Most manufacturers improved CO2 emissions and fuel economy over the last 5 years.
- Through the model year 2023 reporting period, all large manufacturers are in compliance with the light-duty GHG program requirements.
- Manufacturers used different combinations of technology improvements and credit strategies in model year 2023.
- Overall, the industry used credits to maintain compliance, and there remains a large bank of credits for future years.
1. Average new vehicle CO2 emissions and fuel economy continue to improve, aided by growing production of electric vehicles.
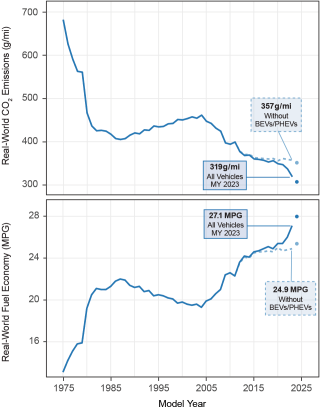
The downward trend for the average new vehicle real-world CO2 emission rate continued in model year 2023. The average model year 2023 vehicle produced 319 grams per mile (g/mi) of CO2, which is 18 g/mi less than the previous model year, and the lowest emission rate on record. Real-world fuel economy increased by 1.1 mpg to a record high 27.1 mpg. The trends in CO2 emissions and fuel economy since 1975 are shown in Figure ES-1.
Many factors are responsible for decreasing new vehicle CO2 emissions, including increased production of a wide range of technologies, as shown in Figure ES-2. This includes increased production of battery electric vehicles and plug-in hybrids which have noticeably influenced the overall trends. Without BEVs and PHEVs, the average new vehicle real-world CO2 emission rate was 38 g/mi higher, and the year over year improvement in model year 2023 was only 1.4 g/mi.
Preliminary data suggest that the average new vehicle CO2 emission rate and fuel economy will continue to improve in model year 2024, and that the impact of BEVs and PHEVs will continue to grow. The preliminary model year 2024 data are shown in Figure ES-1 as a dot because the values are based on manufacturer projections rather than final data.
Figure ES-1. Estimated Real-World Fuel Economy and CO2 Emissions
2. Manufacturers are applying a wide array of electrification technologies.
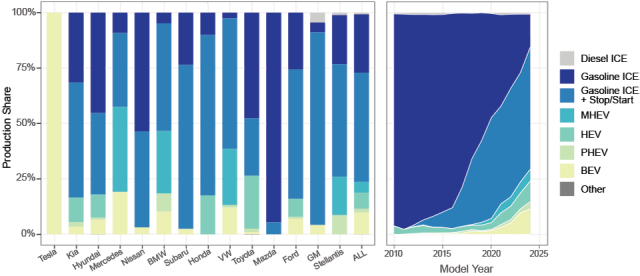
Innovation in the automobile industry has led to a wide array of technologies available to manufacturers to achieve CO2 emissions, fuel economy, and performance goals. Figure ES-2 illustrates manufacturer-specific model year 2023 usage rates for technologies that represent increasing levels of vehicle electrification, as well as the recent adoption trends of those technologies across the industry. The technologies in Figure ES-2 are utilized by manufacturers, in part, to reduce CO2 emissions and increase fuel economy. It is also clear that manufacturers’ strategies to develop and adopt these technologies are unique and vary significantly. Each manufacturer is choosing technologies that best meet the design requirements of their vehicles.
Vehicles that have stop/start systems generally use a larger alternator and enhanced battery, which enables the vehicle to turn off the engine at idle to save fuel. Hybrid vehicles use a battery to recapture braking energy and provide power when necessary, allowing for a smaller, more efficiently operated engine. Hybrids can be separated into smaller “mild” hybrid systems (MHEVs) that provide launch assist but cannot propel the vehicle on their own, and “strong” hybrid systems (HEVs) that can temporarily power the vehicle without engaging the engine. Plug-in hybrid vehicles have both a gasoline engine and a battery that can be charged from an external electricity source, and generally operate on electricity until the battery is depleted or cannot meet driving needs. Full battery electric vehicles employ a battery pack that is externally charged and an electric motor exclusively for propulsion, and do not have an onboard gasoline engine.
In model year 2023, gasoline vehicles with stop/start, mild hybrids, strong hybrids, PHEVs, and BEVs all gained market share and captured their largest market shares on record. The technologies shown in Figure ES-2, along with many others, continue to evolve and impact many aspects of the industry. This trend will likely continue as production of mild hybrids, strong hybrids, PHEVs, and BEVs are expected to grow across the industry in coming years.
Figure ES-2. Technology Share for Large Manufacturers, Model Year 2023
3. Overall CO2 emissions and fuel economy trends have been impacted by both technology improvements and market shifts.
EPA’s light-duty GHG regulations define separate standards for cars and trucks. In model year 2023, 38% of all new vehicles were cars and 62% of all new vehicles were trucks under the GHG regulations. This report further disaggregates vehicles into five vehicle types: sedan/wagon, car SUV, truck SUV, pickup truck, and minivan/van. The distinction between car and truck SUVs is based on the regulatory definitions of cars and trucks, such that SUVs that are four-wheel drive (4WD) or above a weight threshold (6,000 pounds gross vehicle weight) are generally regulated as trucks and classified as truck SUVs for this report. The remaining two-wheel drive (2WD) SUVs are subject to car standards and classified as car SUVs.
Figure ES-3. Production Share and CO2 Emissions by Vehicle Type
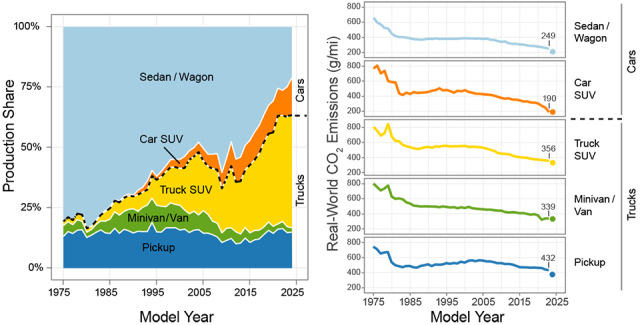
In model year 2023, compared to model year 2022, the four largest vehicle types continued their trends of reduced CO2 emissions and increased fuel economy. Minivan/vans, which accounted for less than 3% of new vehicle production in model year 2023, had CO2 emissions that were unchanged. Most notable is the 60 g/mi, or 24%, reduction in the average new vehicle real-world CO2 emissions within car SUVs. This improvement in CO2 emissions stems from the influx of BEVs within car SUVs, with BEVs now accounting for 36% of all MY 2023 car SUVs. The car SUV vehicle type now has the lowest average new vehicle CO2 emissions.
Since 1975, the market has shifted dramatically away from sedan/wagons and towards truck SUVs and car SUVs. Until recently, the sedan/wagon was the most efficient vehicle type, so the market shifts toward other vehicle types with lower fuel economy and higher CO2 emissions offset some of the fleetwide benefits that otherwise would have been achieved from the improvements within each vehicle type. However, the growth of electric vehicles, particularly within the car SUV vehicle type, is changing the relationship between vehicle types and overall average new vehicle real-world CO2 emissions.
4. Average new vehicle fuel economy, horsepower, weight, and footprint are all increasing.
Overall vehicle trends are influenced both by vehicle technology, and by the changes in the distribution of vehicles being produced. For gasoline (and diesel) vehicles, increased weight, size, or horsepower is likely to result in higher CO2 emissions and lower fuel economy, all else being equal. For BEVs, increased weight, size, or horsepower will impact the vehicle’s efficiency (as measured in kilowatt hours per 100 miles or miles per gallon of gasoline equivalent), however BEVs produce zero tailpipe emissions regardless of their weight, size, or horsepower. The growth of BEV production could also impact the fleet’s overall fuel economy, horsepower, and weight trends, as BEVs are on average more efficient, more powerful, and heavier than comparable vehicles.
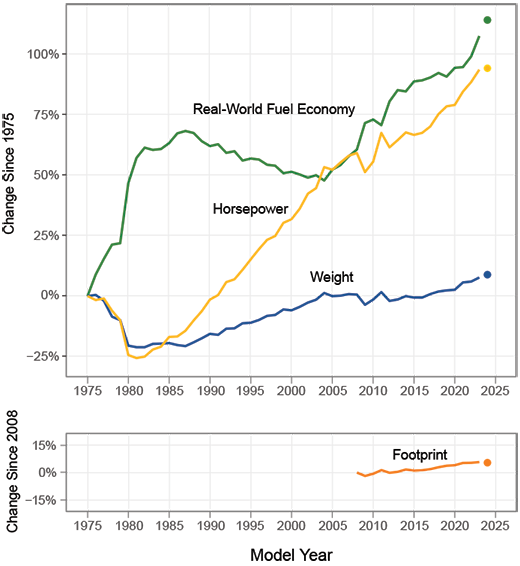
Over the history of this report, there have been three distinct phases, as shown in Figure ES-4. Between 1975 and the early 1980s, average new vehicle fuel economy increased rapidly, while the vehicle weight and horsepower fell. For the next twenty years, average new vehicle weight and horsepower steadily increased, while fuel economy steadily decreased.
Model year 2004 was another inflection point, after which fuel economy, horsepower, and weight have all generally increased together, to historic highs in model year 2023. These more recent trends have been driven by market shifts towards heavier, more powerful vehicle types and technology changes within each vehicle type which have generally increased fuel economy, horsepower, and weight. Vehicle size, measured as the “footprint” or area enclosed by the four tires, has also been generally increasing since EPA began tracking it in 2008. PHEVs and BEVs did not significantly change the average vehicle footprint in model year 2023.
Figure ES-4. Percent Change in Real-World Fuel Economy, Horsepower, Weight, and Footprint
5. Most manufacturers improved CO2 emissions and fuel economy over the last 5 years.
Manufacturer trends over the last five years are shown in Figure ES-5. This span covers the approximate length of a vehicle redesign cycle, and it is likely that most vehicles have undergone design changes in this period, resulting in a more accurate depiction of recent manufacturer trends than focusing on a single year. Differences in manufacturer CO2 emission rates and fuel economy over this period can be attributed to changes in both vehicle design, and the mix of vehicle types produced.
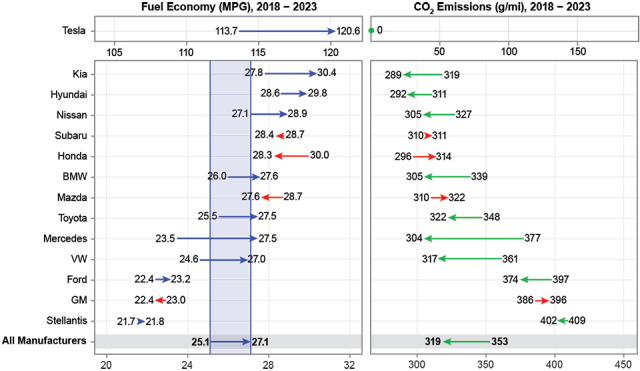
Over the last five years, nine of the fourteen largest manufacturers selling vehicles in the U.S. decreased new vehicle estimated real-world CO2 emission rates. Tesla was unchanged because their all-electric fleet produces no tailpipe CO2 emissions. Between model years 2018 and 2023, Mercedes achieved the largest reduction in CO2 emissions, at 73 g/mi. Volkswagen achieved the second largest reduction in overall CO2 tailpipe emissions, at 44 g/mi, and BMW had the third largest reduction in overall CO2 tailpipe emissions at 34 g/mi. All three of these companies achieved emission reductions across all vehicle types they produce. Ford, Hyundai, Kia, Nissan, Stellantis, and Toyota also achieved overall emission reductions.
Four manufacturers increased new vehicle CO2 emission rates between model years 2018 and 2023 (Honda, Mazda, GM, and Subaru). Honda had the largest increase at 18 g/mi. Mazda had the second largest increase at 12 g/mi, and General Motors had the third largest increase at 11 g/mi. The increase in emissions for Honda was due to a shift in production towards truck SUVs and pickups along with increases in the emission rates within both of those vehicle types compared to model year 2018. The increase in emissions for Mazda was due entirely to a shift from 36% to 89% truck SUV production.
For model year 2023 alone, Tesla’s all-electric fleet had the lowest tailpipe CO2 emissions of all large manufacturers at 0 g/mi. Tesla was followed by Kia at 289 g/mi, Hyundai at 292 g/mi, and Mecedes at 304 g/mi. At 402 g/mi, Stellantis had the highest new vehicle average CO2 emissions and lowest fuel economy of the large manufacturers in model year 2023, followed by GM at 396 g/mi and Ford at 374g/mi. Tesla also had the highest overall fuel economy, followed by Kia, Hyundai, and Nissan.
Figure ES-5 is organized according to increasing fuel economy values, but the order would change if based on CO2 emission rates. This is because BEVs and PHEVs have a different relationship between tailpipe emissions and fuel economy than other vehicles, and because manufacturers have different rates of adoption of BEVs and PHEVs.
Figure ES-5. Changes in Estimated Real-World Fuel Economy1 and CO2 Emissions for Large Manufacturers
1.Electric vehicles, including Tesla’s all-electric fleet, are measured in terms of miles per gallon of gasoline equivalent, or mpge.
6. Through the model year 2023 reporting period, all large manufacturers are in compliance with the light-duty GHG program requirements.
EPA’s GHG program is an averaging, banking, and trading program. An ABT program means that the standards may be met on a fleet average basis, manufacturers may earn and bank credits to use later, and manufacturers may trade credits with other manufacturers.2 This provides manufacturers flexibility in meeting the standards while accounting for vehicle design cycles, introduction rates of new technologies and emission improvements, and evolving consumer preferences.
Within a model year, manufacturers with average fleet emissions lower than the standards generate credits, and manufacturers with average fleet emissions higher than the standards generate deficits. Any manufacturer with a deficit at the end of the model year has up to three years to offset the deficit with credits earned in future model years or purchased from another manufacturer. A manufacturer may not report any deficits for more than 3 years in a row.
Eleven of the fourteen largest manufacturers ended model year 2023 with positive or zero credit balances and are thus in compliance for model year 2023 and all previous years of the GHG program, as credits may not be carried forward unless deficits from all prior model years have been resolved. Volkswagen and Mazda ended model year 2023 with a deficit and must offset their deficits by the model year 2026 reporting period to remain in compliance. Kia ended model year 2023 with a deficit, which is their third straight model year reporting a deficit. Kia must offset all deficits by the model year 2024 reporting period to remain in compliance.
Figure ES-6. GHG Credit Balance for Large Manufacturers, after Model Year 2023
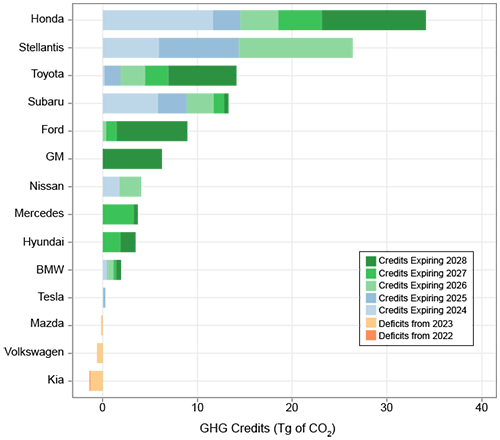
Total credits in Figure ES-6 are shown in Teragrams (Tg; one million Megagrams), and account for manufacturer performance compared to their standards, expected vehicle lifetime miles driven, and the number of vehicles produced by each manufacturer, for all years of the GHG program. The credits accumulated by each manufacturer will be carried forward for use in future model years or until they expire. Credit expiration dates are based on the model year in which they were earned.
2.Credits accrued under EPA's light-duty GHG program are transferable between passenger car and light truck fleets, across model years, and between manufacturers as defined in Title 40 CFR Part 86. The NHTSA CAFE program also includes ABT provisions, but additional credit transfer limitations apply.
7. Manufacturers used different combinations of technology improvements and credit strategies in model year 2023.
Determining manufacturer compliance with EPA’s GHG program requires accounting for a manufacturer’s credit balance over the life of the program. However, it is also useful to look at manufacturer performance within the most recent model year. Figure ES-7 illustrates the performance of individual large manufacturers in model year 2023 compared to their effective overall standard, in terms of an average vehicle grams per mile emission rate. This “snapshot” provides insight into how the large manufacturers performed against the standards in model year 2023, however it cannot be used to determine individual manufacturer compliance status with the overall program.
Tesla and BMW ended model year 2023 with their average new vehicle GHG emissions performance below their respective standards. This result, combined with the fact that these manufacturers all had a credit balance at the end of model year 2022, allowed these manufacturers to achieve compliance with the GHG program through model year 2023 and bank or sell additional credits in model year 2023.
Twelve of the fourteen large manufacturers ended model year 2023 with emission performance exceeding their overall standard. Nine of these manufacturers used banked or purchased credits, along with technology improvements, to achieve compliance in model year 2023. As noted above, Kia, VW, and Mazda ended the model year with deficits, but the program allows manufacturers up to three years to offset any deficits and remain in compliance.
Figure ES-7. CO2 Performance and Standards by Manufacturer, Model Year 2023
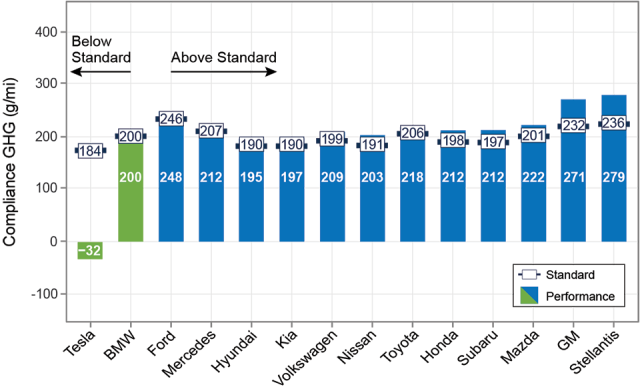
The manufacturer performance values shown in Figure ES-7 are based on the average new vehicle tailpipe emissions for each manufacturer and include optional credits available to manufacturers in model year 2023. Credits can be created through an advanced technology multiplier for each electric vehicle or plug-in hybrid produced, improved air conditioning systems, or technologies that are not directly measured on standard EPA tests (off-cycle credits). These credits vary between manufacturers, but the industry averaged 4.1 g/mi credits due to the advanced technology multiplier, 21.2 g/mi of credits due to improved air conditioning systems, and 8.6 g/mi of credits due to off-cycle technologies. Tesla produces electric vehicles with zero tailpipe emissions, but also claimed credits for advanced technology vehicles, air conditioning improvements, and off-cycle technologies to achieve the negative performance value shown in Figure ES-7.
8. Overall, the industry used credits to maintain compliance, and there remains a large bank of credits for future years.
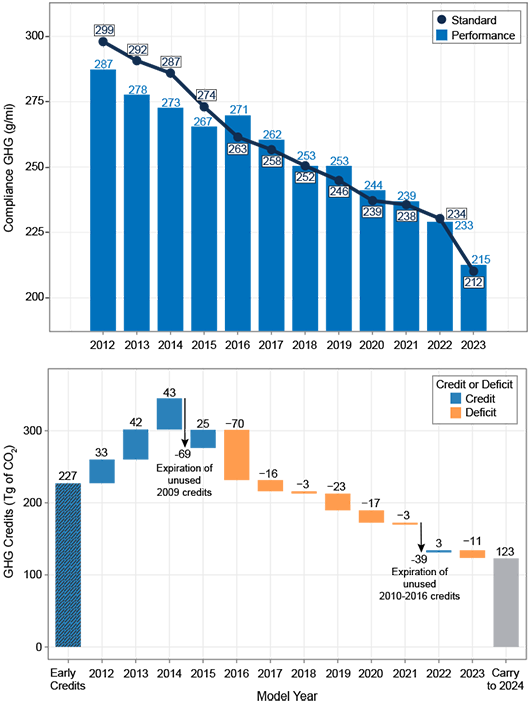
The industry ended model year 2023 with a credit balance of 123 Tg. This credit balance is the result of the overall industry performance against the standards within each model year, as well as the generation of early credits, credit expirations, and the sum of all credit averaging, banking, and trading allowed by EPA’s GHG program. Under the GHG Program, manufacturers were able to accrue “early credits,” before the GHG standards took effect in model year 2012, for early deployment of efficient vehicles and technology. Overall, the industry was able to accrue a large volume of credits due to this provision, although some of these credits had restrictions on their use, and all credits have regulatory expiration dates. In model years 2012 through 2014, manufacturers continued to generate credits, as the industry GHG performance was below the industry-wide average standard. At the end of model year 2014, unused early credits generated from model year 2009 expired, which reduced the overall credit balance. In model year 2015, the industry again generated credits, however from model year 2016-2021 the industry GHG performance was above the standard, resulting in net withdrawals from the bank of credits to maintain compliance. Unused credits generated in model years 2010-2016 expired at the end of model year 2021, and unused credits from model year 2017 expired at the end of model year 2023, which further drew down the overall industry credit balance. In addition, GM retired 49 Tg of credits, most from model year 2016, pursuant to a resolution with EPA regarding in-use verification program testing results.
In model year 2023, the overall industry GHG performance value decreased 18 g/mi to 215 g/mi, while the standard fell 23 g/mi to 212 g/mi. As a result, the overall industry performance was above the standard, and the industry generated 11 Tg of deficits. An additional 0.5 Tg of credits expired. The overall industry emerged from model year 2023 with a bank of 123 Tg of GHG credits available for future use, after offsetting all deficits, as seen in Figure ES-8.
Figure ES-8. Industry Performance and Standards, and Overall Credit Balance
The credits available at the end of model year 2023 will expire according to the schedule defined by the GHG Program and detailed in Section 5 of this report. An active credit market has allowed manufacturers to purchase credits to demonstrate compliance, with fifteen manufacturers selling credits, twenty manufacturers purchasing credits, and approximately 140 credit trades since 2012. As of October 1, 2023, about 270 Tg of credits have been traded between manufacturers.
