CMAQ Dynamic Evaluation and Trend Analysis
Are We Capturing the Observed Changes in Air Quality Due to Changes in Emissions or Meteorology?
Air quality models such as CMAQ, are used by researchers and air quality management agencies worldwide to estimate the impact of different strategies for reducing air pollution. For example, the model may be run to see how ozone and PM2.5 levels would change under different fuel standards on cars and trucks.
In addition, CMAQ is used to inform the public about changes in air quality associated with changing weather conditions. In this way, the model serves as a "numerical laboratory" to improve our understanding of various atmospheric pollution problems including acid deposition, elevated tropospheric ozone, smog and greenhouse gases. See:
Dynamic evaluation is the method of comparing the model simulated change in air pollution levels due to changes in emissions or meteorology to observed changes. EPA scientists are employing several approaches when conducting dynamic evaluation:
- Comparison of observed and modeled air quality between pairs of years characterized by different emissions or meteorology.
- Analysis of long-term (10-20 years) time series of observations and model simulations.
- Use of “cross” simulations to separate changes in pollutants due to emissions and changes due to meteorology.
Comparing Air Quality Across Pairs of Years
Often dynamic evaluation studies focus on comparing air quality between two historic years that had significantly different emissions. Typically, such emission differences are caused by the implementation of an emission reduction strategy such as EPA’s Nitrogen Oxides State Implementation Plan Call (NOX SIP Call). The NOX SIP Call was targeted at reducing NOX emissions from power plants in the eastern U.S. and was implemented in 2003 and 2004. Several evaluation studies compared observed and modeled changes in air quality between 2002 (before the implementation of the emission reductions) and 2005 (after the implementation of the emission reductions) (e.g., Gilliland et al., 2007).
While results showed that the modeled decrease in air quality between the two years tended to be smaller than the observed decrease, due to the limited dataset it was not possible to determine whether this underestimate was caused by a smaller-than-observed response to changes in emissions, meteorology, or a combination of both. Subsequent work using longer records of observations and CMAQ simulations showed that conclusions drawn from pairwise comparisons of individual years are sensitive to the choice of these particular years, suggesting that varying model performance in individual years makes it difficult to draw robust conclusions regarding the model’s responsiveness to changing environmental conditions and to diagnose and isolate the source of model error in dynamic evaluation studies.
Time Series of Model Simulations
Performing and analyzing long-term air quality simulations driven by year specific meteorology and emissions allows us to compare observed and simulated trends in air quality. Such multi-year analyses can improve on the robustness of dynamic evaluation studies that rely on individual years. We can more confidently assess the model’s response to emission reductions, i.e., results are not as sensitive to the chosen starting/ending year.
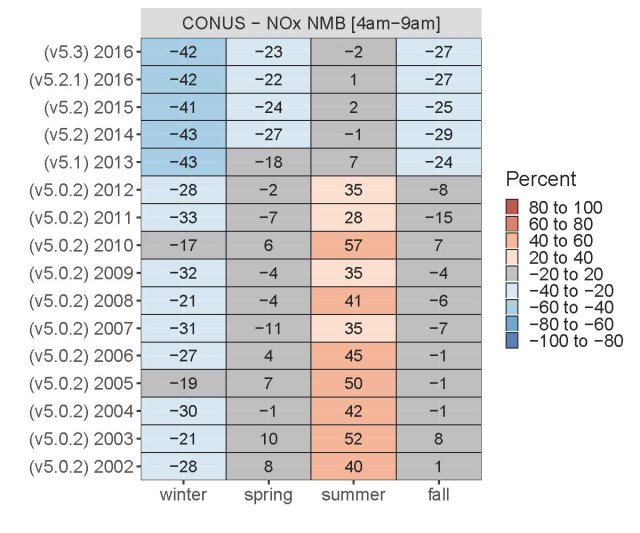
Evaluation of NOX emissions and air quality estimates: Using 2002 – 2016 CMAQ simulations, EPA researchers investigated discrepancies between modeled estimates of atmospheric NOX and total reactive nitrogen (NOY) concentrations and ambient measurements. The aim of the study was to determine whether these discrepancies were driven by mobile source emissions estimates or other model processes. The multi-year CMAQ simulations were used to identify key parameters and processes impacting NOX and NOY model predictions including: MOtor Vehicle Emission Simulator (MOVES) inputs and results, spatial and temporal allocation of emissions, meteorology, mixing, and treatment of dispersion, chemistry and deposition in CMAQ. The analysis showed that CMAQ overestimation of NOX was most common in the summer, with distinct morning and evening peaks, while CMAQ tended to underestimate NOX in winter. Model over-predictions were found to be due to multiple compounding factors that each contributed to a portion of the bias. Additionally, improvements in the NOX mobile source emission inventory and updates in recent CMAQ versions were found to substantially reduce the summer overestimation of NOX. Findings from this work are summarized in Toro et al. (2021) and EPA report EPA-454/R-21-008 (2021).

Evaluation of trends in CMAQ ozone: Using a 1990 – 2010 time series of WRF-CMAQ simulations (Xing et al., 2013; Gan et al., 2015), EPA researchers compared observed and simulated trends in daily maximum 8-hr (MDA8) ozone concentrations across the contiguous U.S. (Foley et al., 2015a).
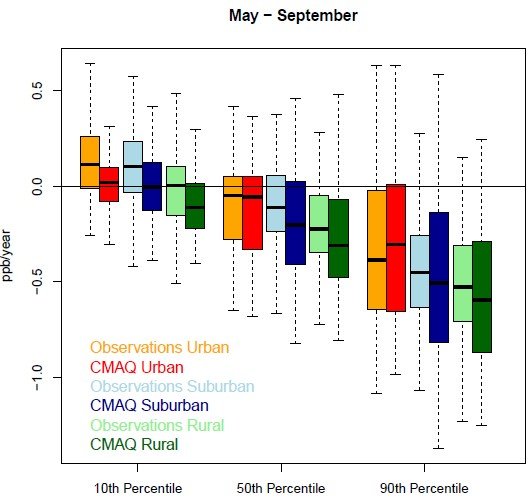
Figure 1 shows the distribution of ozone trends across 365 monitoring locations for the 10th, 50th and 90th percentiles of summer MDA8 ozone. The boxplots show decreasing trends (i.e. slope < 0) at a majority of sites for all land use types for the 50th and 90th percentiles in both observations and model simulations. For the 10th percentile ozone concentrations often show an upward trend, though the results vary by land use type. These results reflect a narrowing of the observed ozone distribution and indicate that the modeling system has skill in reproducing the impacts of decreasing emissions on ozone concentrations.
Evaluation of trends in CMAQ deposition: Using a different set of 2002 – 2012 CMAQ simulations, researchers also investigated trends in wet deposition of nitrate, ammonium, and sulfate (Zhang et al., 2019). Results show that in the east, trends in model predictions for annual total wet deposition of these species are consistent with National Atmospheric Deposition Program (NADP) observations. Model bias in wet deposition is correlated with bias in the model predicted precipitation. Results also showed an underestimation in western states that is likely due to a missing emissions source, and an overprediction in Pacific states that is believed to be due to errors in precipitation as well as issues with model boundary conditions.
This work was extended in Benish et al., 2022 which used CMAQ output from the EQUATES project to study regional trends of nitrogen and sulfur deposition in the United States from 2002 to 2017. Modeled wet deposition and trends in wet deposition were improved by bias-adjusting model output with precipitation data and wet deposition measurements from the NADP National Trends Network. To indirectly evaluate modeled dry deposition, the authors compare the model-simulated annual average concentrations with observations collected at EPA's CASTNET sites. The EQUATES CMAQ simulations reproduce the decreasing trend in observed concentrations across the two decades (correlations greater than 0.79) but overpredict trends of sulfur dioxide and total nitrate concentrations and underpredict trends of ammonium and sulfate concentrations.
Cross Simulations
“Cross” simulations can be used to better diagnose errors identified in dynamic evaluation studies and to quantify the impact of retrospective emission controls by removing the impacts of meteorology during the control period to provide valuable information to policy makers.
Foley et al. (2015b) used CMAQ simulations for 2002 and 2005 to separate the change in ozone due to changes in emissions vs changes in meteorology. In addition to two base year simulations, two cross simulations were created: (1) 2002 emissions with 2005 meteorology and (2) 2005 emissions with 2002 meteorology. Careful attention was given to creating the emissions inputs to account for the impact of meteorology on emissions. For example, a method was developed to adjust measured emissions data for power plants to account for differences in electricity demand driven by year-specific meteorology.
Results showed that for ozone concentrations above the 50th percentile, the 2005 – 2002 decrease in ozone attributed to emissions reduction is much larger than the decrease attributable to changes in meteorology. Model errors in predicting the change in mean ozone due to meteorology did not fully explain why the model predictions underestimate the observed ozone reduction. This suggests that the observed decrease in ozone is primarily driven by emissions changes and these changes are not fully captured by the modeled emission inputs. This conclusion supports the results from previous dynamic evaluation using earlier versions of CMAQ and different analysis techniques (Kang et al., 2013; Napelenok et al., 2011).
Summary and Ongoing Research
Dynamic evaluation can help build confidence in the use of the CMAQ modeling system to estimate the effects of emission reductions. However, evaluation studies that focus on individual pairs of years may not fully assess the model’s ability to capture emission-induced trends due to changes in model bias over time and the confounding effect of meteorological variability. Longer model simulations offer the opportunity to account for meteorological variability while model “cross” simulations can be used to isolate the effects of emission changes on pollutant concentrations from the effects of meteorological changes to improve diagnostic evaluation. Sensitivity simulations can be used to quantify changes in how the model responds to cuts in anthropogenic emissions compared to previous model versions. Such sensitivity analysis is now a standard part of the evaluation of new CMAQ releases.
References
Benish, S. E. and Bash, J. O. and Foley, K. M. and Appel, K. W. and Hogrefe, C. and Gilliam, R. and Pouliot, G. (2022) Long-term regional trends of nitrogen and sulfur deposition in the United States from 2002 to 2017, Atmospheric Chemistry and Physics, doi: https://doi.org/10.5194/acp-22-12749-2022
Foley, K., Hogrefe, C., Xing, J., Gan, C., Wong, D., Pleim, J., Mathur, R., Roselle, S., Simon, H., & Reff, A. (2015a). A Comparison of Observed and Simulated 1990 – 2010 U.S. Ozone Trends. A&WMA’s 108th Annual Conference & Exhibition, Raleigh, NC, June 22 - 25.
Foley, K., Hogrefe, C., Pouliot, G., Possiel, N., Roselle, S., Simon, H., & Timin, B. (2015b). Dynamic evaluation of CMAQ part I: Separating the effects of changing emissions and changing meteorology on ozone levels between 2002 and 2005 in the eastern US. Atmospheric Environment, 103, 247-255.
Gan, C.-M., Pleim, J., Mathur, R., Hogrefe, C., Long, C. N., Xing, J., Wong, D., Gilliam, R., & Wei, C. (2015), Assessment of long-term WRF–CMAQ simulations for understanding direct aerosol effects on radiation "brightening" in the United States, Atmos. Chem. Phys., 15, 12193-12209, https://doi.org/10.5194/acp-15-12193-2015.
Gilliand, A., Hogrefe, C., Pinder, R.W., Godowitch, J.M., Foley, K., & Rao, S. (2007). Dynamic Evaluation of Regional Air Quality Models: Assessing Changes to O3 Stemming from Changes in Emissions and Meteorology. Atmospheric Environment, 42(20), 5110-5123.
Kang, D., Hogrefe, C., Foley, K., Napelenok, S., Mathur, R., & Rao, S. (2013). Application of Kolomogorov-Zurbenko Filter and the decoupled direct 3D method for the dynamic evaluation of a regional air quality model. Atmospheric Environment, 80, 58-69.
Napelenok, S., Foley, K., Kang, D., Mathur, R., Pierce, T., & Rao, S.T. (2011). Dynamic Evaluation of Regional Air Quality Model's Response to Emission Reductions in the Presence of Uncertain Emission Inventories. Atmospheric Environment, 45, 4091-4098.
Toro, C., Foley, K., Simon, H., Henderson, B., Baker, K., Eyth, A., Timin, B., Appel, W., Luecken, D., Beardsley, M., Sonntag, D., Possiel, N. Evaluation of 15 years of modeled atmospheric oxidized nitrogen compounds across the contiguous United States. Elem Sci Anth (2021) 9: 1, https://doi.org/10.1525/elementa.2020.00158
EPA-454/R-21-008 (2021), Overview of Progress and Findings from the Cross-EPA Coordination Effort for Understanding and Evaluating NOX Emissions Discrepancies (PDF), U.S. Environmental Protection Agency.
Xing, J., Pleim, J., Mathur, R., Pouliot, G., Hogrefe, C., Gan, C.-M., & Wei, C. (2013), Historical gaseous and primary aerosol emissions in the United States from 1990 to 2010, Atmos. Chem. Phys., 13, 7531-7549, https://doi.org/10.5194/acp-13-7531-2013 .
Zhang, Y., Foley, K., Schwede, D., Bash, J., Pinto, J., Dennis, R. (2019) A Measurement‐Model Fusion Approach for Improved Wet Deposition Maps and Trends, Journal of Geophysical Research - Atmospheres, 124, 4237-4251, https://doi.org/10.1029/2018JD029051 .

