CWA Analytical Methods for Per- and Polyfluorinated Alkyl Substances (PFAS)
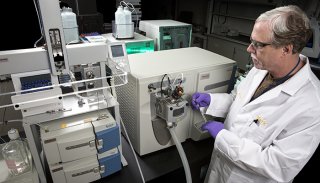
The EPA developed two new analytical methods to test for PFAS compounds in wastewater, as well as other environmental media.
- Background
- Method 1633 for 40 PFAS Compounds
- Method 1621 for Adsorbable Organic Fluorine
- Documents
- Related Information
Background
There are thousands of different PFAS chemicals of varying carbon chain lengths and different functional groups. Analyzing them in a comprehensive way has been a challenge that scientists at all levels of government are working to address. Different offices within the EPA have published methods to test for certain PFAS in drinking water and in non-potable water and continues to work on methods for other matrices. The methods described below are the result of the efforts of the Clean Water Act Methods Program.
Method 1633 for 40 PFAS Compounds
The EPA’s Office of Water, in partnership with the Department of Defense’s (DoD) Strategic Environmental Research and Development Program, has published Method 1633, “Analysis of Per- and Polyfluoroalkyl Substances (PFAS) in Aqueous, Solid, Biosolids, and Tissue Samples by LC-MS/MS,” a method to test for 40 PFAS compounds in wastewater, surface water, groundwater, soil, biosolids, sediment, landfill leachate, and fish tissue. This method can be used in various applications, including National Pollutant Discharge Elimination System (NPDES) permits. The method will support NPDES implementation by providing a consistent PFAS method that has been tested in a wide variety of wastewaters and contains all the required quality control (QC) procedures for the Clean Water Act (CWA). While the method is not nationally required for CWA compliance monitoring until the EPA has promulgated it through rulemaking, the EPA recommends it now for use in individual permits.
DoD led the multi-laboratory validation study of the procedure in collaboration with the EPA Office of Water, the Office of Land and Emergency Management, and the Office of Research and Development. The Office of Water used the results of the multi-laboratory validation study to finalize the method and add formal performance criteria. The Office of Water encourages laboratories, regulatory authorities, and other interested parties to review and use the method, with the understanding that it may undergo revision during a rulemaking process.
The EPA is grateful for the constructive feedback received from multiple interested parties to date, which resulted in many of the changes reflected in the final method.
Errata
Subsequent to the January 31, 2024 release of the first “non-draft” version of EPA Method 1633, the EPA was advised of several minor concerns with that version of the method. The majority are strictly minor editorial errors in callouts to tables and other sections of the method. The EPA expects to propose Method 1633 at 40 CFR Part 136 in the coming months. Rather than issuing a new version of the method prior to that proposal, the EPA has prepared this list of the errata as an adjunct to the January 2024 version of the method.
The EPA will either revise the method or publish these errata as an official EPA document before that proposal. For now, posting this list on the web page allows the EPA the flexibility to address any additional minor errors that may be identified, or clarifications that are needed.
The following table provides the list of those errata that shows the original text and the corrected text side by side. In some of these entries, unaffected text that appears before or after the sentence with the error has been omitted and replaced with an ellipsis (i.e., three dots) for brevity of this presentation.
Editorial Errors |
||
Section |
Original Affected Text |
Corrected Text (changes in red or |
8.2.1 Note |
Note: In the absence of source-specific information (e.g., historical data) on the levels of PFAS or project-specific requirements, collect at least three aliquots of all aqueous samples to allow sufficient volume for an original whole-volume analysis, a re-extraction and second analysis, and for the determination of percent solids and for pre-screening analysis. … |
Note: In the absence of source-specific information (e.g., historical data) on the levels of PFAS or project-specific requirements, collect at least three aliquots of all aqueous samples to allow sufficient volume for an original whole-volume analysis, a re-extraction and second analysis, and for the determination of total suspended solids and for pre-screening analysis. … |
10.1.1 |
During the development of this method, instrumental parameters were optimized for the precursor and product ions of the linear isomers of the target analytes listed on Table 9. If a qualitative or quantitative standard containing an isomeric mixture (branched and linear isomers) of an analyte is commercially available for an analyte, the quantification ion used must be the quantification ion identified in Table 9, unless interferences render the product ion unusable as the quantification ion. … |
During the development of this method, instrumental parameters were optimized for the precursor and product ions of the linear isomers of the target analytes listed on Table 10. If a qualitative or quantitative standard containing an isomeric mixture (branched and linear isomers) of an analyte is commercially available for an analyte, the quantification ion used must be the quantification ion identified in Table 10, unless interferences render the product ion unusable as the quantification ion. … |
10.2.2.5 |
… The laboratory must demonstrate that the analytical conditions provide a separation of at least 1 minute between the bile salts and the retention time window of PFOS, as described in Section 7.3.3. … |
… The laboratory must demonstrate that the analytical conditions provide a separation of at least 1 minute between the bile salts and the retention time window of PFOS, as described in Section 10.3.5. … |
10.3.3.2 |
… The response ratio (RR) for each native compound calibrated by isotope dilution is calculated according to the equation below, separately for each of the calibration standards, using the areas of the quantification ions (Q1) with the m/z shown in Table 9. … |
… The response ratio (RR) for each native compound calibrated by isotope dilution is calculated according to the equation below, separately for each of the calibration standards, using the areas of the quantification ions (Q1) with the m/z shown in Table 10. … |
11.0 |
For aqueous samples that contain particles and solid samples, percent solids are determined using the procedures in Section 11.1. … |
For aqueous samples that contain particles and solid samples, total suspended solids are determined using the procedures in Section 11.1. … |
11.2.5 |
… If necessary, adjust pH with 50% formic acid (Section 7.1.13.4) or ammonium hydroxide (or with 5% formic acid [Section 7.1.13.3] and 3% aqueous ammonium hydroxide [Section 7.1.6.2]). … |
… If necessary, adjust pH with 50% formic acid (Section 7.1.13.4) or ammonium hydroxide (or with 5% formic acid [Section 7.1.13.3] and 3% aqueous ammonium hydroxide [Section 7.1.6]). … |
11.4.9 |
… Check that the pH = 6.5 ± 0.5 and adjust as needed with 50% formic acid (Section 7.1.13.4) or ammonium hydroxide (or with 5% formic acid [Section 7.1.13.3] and 3% aqueous ammonium hydroxide [Section 7.1.6.2]). … |
… Check that the pH = 6.5 ± 0.5 and adjust as needed with 50% formic acid (Section 7.1.13.4) or ammonium hydroxide (or with 5% formic acid [Section 7.1.13.3] and 3% aqueous ammonium hydroxide [Section 7.1.6]). … |
13.3 |
… The volume injected for samples and QC samples must be identical to the volume used for calibration (Section 10.2.3). … |
… The volume injected for samples and QC samples must be identical to the volume used for calibration (Section 10.3.2). … |
14.3.5 |
Using the data from the CV standard, compute the ion abundance ratio (IAR) for each target analyte listed with a confirmation ion mass in Table 9, using the equation below. … |
Using the data from the CV standard, compute the ion abundance ratio (IAR) for each target analyte listed with a confirmation ion mass in Table 10, using the equation below. … |
Note below 14.3.5 |
Note: Some of the target analytes in Table 9 do not produce confirmation ions or produce confirmation ions with very low relative abundances; therefore, for those analytes, the IAR does not apply. |
Note: Some of the target analytes in Table 10 do not produce confirmation ions or produce confirmation ions with very low relative abundances; therefore, for those analytes, the IAR does not apply. |
14.5.1 |
After completing the first 6 steps in the analytical sequence described in Section 13.3, analyze the extracts of the low-level OPR (LLOPR) and the mid-level OPR) (Sections 11.3.3, 11.3.2, and 11.4.2) prior to analysis of samples from the same batch to ensure the analytical process is under control. |
After completing the first 6 steps in the analytical sequence described in Section 13.3, analyze the extracts of the low-level OPR (LLOPR) and the mid-level OPR) (Sections 11.2.3, 11.3.2, and 11.4.2) prior to analysis of samples from the same batch to ensure the analytical process is under control. |
14.5.2 |
Compute the percent recovery of the native compounds by the appropriate quantification method depending on the compound (Section 10.3). Compute the percent recovery of each EIS compound by the non-extracted internal standard method (Sections 1.2 and 10.3). |
Compute the percent recovery of the native compounds |
15.2 |
… The EIS is quantitated with respect to a non-extracted internal standard (NIS), as shown in Table 9, using the response ratios or response factors from the most recent multi-level initial calibration (Section 10.3). … |
… The EIS is quantitated with respect to a non-extracted internal standard (NIS), as shown in Table 10, using the response ratios or response factors from the most recent multi-level initial calibration (Section 10.3). … |
In addition to these minor editorial errors, the EPA has been asked to provide clarifications for several sections of the January 2024 method that may not be clear to some readers. Those clarifications are provided below and also will be addressed in the version of the method that is part of the upcoming proposed Methods Update Rule (MUR).
Clarifications |
||
Section |
Potential Issue |
EPA Clarification |
8.5.1 |
The method does not call out extracting samples ASAP for NFDHA in aqueous samples, as it does for solid and tissue samples. However, Section 8.5.5 makes it sound like this caveat is required for all matrices. |
The single-laboratory validation study included a holding time study that covered both samples and extracts. The observed behavior of some of the ether sulfonates in the extracts led to the shorter, 28-day extract holding time for those analytes in soils, sediments, and tissues, versus 90 days for the extracts for all other analytes. The caveat at the end of Section 8.5.5 is incorrect in that section. In the revised method, EPA will delete that sentence from Section 8.5.5, as shown below: Store sample extracts in the dark at or below 6 ºC until analyzed. If stored in the dark at or below |
10.1.7 |
The mass calibration must be verified prior to the analysis of any standards and samples and after each subsequent mass calibration. Each laboratory must follow the instructions for their instrument software to confirm the mass calibration, mass resolution, and peak relative response. In addition to the mass calibration verification performed using a standard specified by the manufacturer, the mass calibration must also be verified with respect to the ion masses monitored by this method. |
Some readers were misinterpreting the section to mean that a mass calibration verification was needed with every sample batch, which is not true. As part of this clarification, the text will be revised to read: The mass calibration must be verified |
10.1.7.1 and 10.1.7.2 |
These sections will be deleted in their entirety. Commenters noted the discrepancy between calling out “unit resolution” (e.g., 1 Da) and then having a QC specification of 0.2 Da. Different manufacturers have different mass shift criteria. Some are wider than 0.2 Da. Therefore, the text in Section 10.1.7 will be revised as described above to resolve that discrepancy as well as addressing the frequency issue. |
|
11.1.1.5 vs. 11.2.4 |
Section 11.1.1.5 states the following: Subject to project-specific approval, laboratories may utilize other documented strategies for minimizing the disruptions due to SPE clogging and slow extractions, including centrifuging the sample before adding the EIS and treating the supernatant aqueous phase and the solid phase as separate samples. Section 11.2.4 states the following: If centrifugation is used to prevent samples with high TSS from clogging the SPE, the EIS compounds must be spiked into the original sample container prior to centrifugation. |
The presumed conflict is due to the example provided in 11.1.1.5. That use of centrifugation is subject to approval by the client, and the example involves two closely related steps: centrifuging the sample into two “fractions” and then treating the fractions as separate samples from that point on, including two separate extractions. 11.2.4 is the more general case where centrifugation is used, but the solids are added to the top of the SPE column and only one extraction is performed. That use of centrifugation would not require project-specific approval. The EPA will revise Section 11.2.4 and move some of the text to a new Note in that section, as shown below. Spike an aliquot of EIS solution (Section 7.3.1) directly into the sample in the original bottle (or subsampled bottle) as well as to the bottles prepared for the QC samples. Mix by swirling the sample container. Note: Except as described in Section 11.1.1.5, where centrifugation is used to create two separate samples, when centrifugation is used to prevent samples with high TSS from clogging the SPE but the solids are extracted along with the supernatant liquid, the EIS compounds must be spiked into the original sample container prior to centrifugation. |
15.1.3 |
Please clarify why the ratio requirement does not apply to PFPeA as Table 10 includes a confirmation ion for this PFAS. |
The last sentence in the second paragraph of Section 15.1.3 reads “The ratio requirement does not apply for PFBA, PFPeA, NMeFOSE, NEtFOSE, PFMPA, and PFMBA because suitable (not detectable or inadequate S/N) secondary transitions (Q2) are not available.” As noted in the parenthetical phrase in the sentence above, those six target PFAS do not have “suitable secondary transitions.” In some cases, there is no detectable transition ion, and in other cases, such as PFPeA, the signal-to-noise ratio for the ion at m/z 68.9 is too low to be used reliably. The EPA will revise the last sentence in Section 15.1.3 as follows: The ratio requirement does not apply to PFBA, PFPeA, NMeFOSE, NEtFOSE, PFMPA, or PFMBA because secondary transitions (Q2) for these analytes are either not detectable or have inadequate S/N to be reliably used in an ion ratio calculation. |
15.2 Equation |
Recommend adding the percent solids to the equation for solid samples. |
The final term in the equation, Ws is described as the sample volume in liters for an aqueous sample, or the weight in grams of a solid sample. The solid sample weight should be expressed in terms of dry weight until such time as the EPA revises the method, at which time, we will add an additional term for the percent solids that only will apply to soil, sediment, and biosolid samples. |
15.3.1 and 15.3.2 |
Section 15.3.1 states that a diluted extract result can be used if: “… the responses for any EIS in the diluted extract that is associated with one of those analytes meet the S/N and retention time requirements in Sections 15.1.1 and 15.1.2, and the EIS recoveries from the analysis of the diluted extract are greater than 5% ...” The problem with this statement is that the EIS percent recovery should not change significantly when the extract is diluted. The EIS recovery is calculated using the NIS response, which will also be diluted proportionately. Thus, the EIS recovery should not change when the extract is diluted. |
The EPA will revise Sections 15.3.1 and 15.3.2 as follows: 15.3.1 If the Q1 area for any compound exceeds the calibration range of the system, dilute a subsample of the sample extract with the methanolic ammonium hydroxide and acetic acid solution in Section 7.1.9 and analyze the diluted extract for the analyte(s) that exceeded the calibration range. If the responses for any EIS in the diluted extract that is associated with one of those analytes meet the S/N and retention time requirements in Sections 15.1.1 and 15.1.2, and the EIS recoveries from the analysis of the diluted extract meet the requirements in Tables 6 or 8 If the EIS responses in the diluted extract do not meet those S/N and retention time requirements, then the compound cannot be measured reliably by isotope dilution in the diluted extract. In such cases, the laboratory must take a smaller aliquot of any affected aqueous sample and dilute it to 500 mL with reagent water and prepare and analyze the diluted aqueous sample, or prepare and analyze a smaller aliquot of soil, biosolid, sediment, or tissue sample. Adjust the calibration ranges, detection limits, and LOQs to account for the tested sample mass/volume and any dilution factors.
Note: 15.3.2 If the recovery of any EIS in a sample is outside of the acceptance limits in Tables 6 or 8, then a diluted sample extract must be analyzed, or a smaller sample mass/volume must be extracted (Section 15.3.1). |
Method 1621 for Adsorbable Organic Fluorine
The EPA’s Office of Water has published Method 1621, “Determination of Adsorbable Organic Fluorine (AOF) in Aqueous Matrices by Combustion Ion Chromatography (CIC),” a method to measure the aggregate concentration of organofluorines (molecules with a carbon-fluorine bond) in wastewater. The most common sources of organofluorines are PFAS and non-PFAS fluorinated compounds such as pesticides and pharmaceuticals.
AOF is a method-defined parameter, meaning that the results of the measurement are dependent on the manner in which the measurement is made. The method does not quantify all of the organofluorine it captures with the same accuracy and has some known interferences that are discussed in the first section of the method. The method tells the user that organofluorines are present but cannot identify which specific organofluorines are present. The strength of the method is that it can broadly screen for thousands of known PFAS compounds at the part per billion level in aqueous (water) samples.
The Office of Water led a multi-laboratory validation study of Method 1621. The Office of Water used the results of the multi-laboratory validation study to finalize the method and develop formal performance criteria. The Office of Water encourages interested parties to review and use the method, with the understanding that it may undergo revision during a rulemaking process. Method 1621 is not nationally required for CWA compliance monitoring until the EPA has promulgated it through rulemaking.
Documents
Single-Laboratory Validation Study of PFAS by Isotope Dilution LC-MS/MS (pdf)