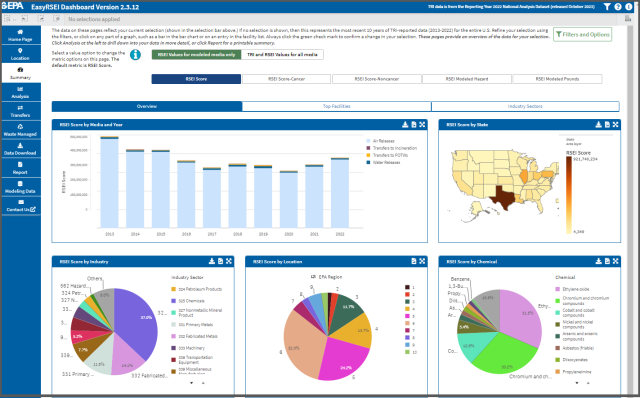
EasyRSEI Basics
EasyRSEI is now an easy-to-use web dashboard that you can access through an internet browser with no downloading required. EasyRSEI contains EPA's Risk-Screening Environmental Indicators (RSEI) model results for Toxics Release Inventory (TRI) reporting years (2013-2022). A separate all-years EasyRSEI dashboard is available for users interested in all years of data (going back to 1988).
With the EasyRSEI dashboard you can:
- View preformatted graphs and charts.
- Filter the data by EPA region, state, year, industry, NAICS, chemical, and other groupings.
- View RSEI risk-related results, hazard-based results, and pounds-based results.
- Print or save preformatted reports based on data selection(s).
- View and select facilities on a map.
- Export screenshots and data tables based on your selection(s).
- Look at off-site transfers by origin facility or receiving facility, including international receiving facilities.

The current version of EasyRSEI contains results from RSEI Version 2.3.12. Each new version of RSEI (and EasyRSEI) incorporates the latest Toxics Release Inventory (TRI) data, as well as changes to the input RSEI data and the methodology used to process the data and calculate the results.
EasyRSEI online help
Go to EasyRSEI
Results in EasyRSEI
EasyRSEI contains a number of different results, including:
- TRI Pounds
- RSEI Modeled Pounds
- RSEI Hazard
- RSEI Modeled Hazard
- RSEI Hazard-Cancer
- RSEI Hazard-Noncancer
- RSEI Score
- RSEI Score-Cancer
- RSEI Score-Noncancer
The results in EasyRSEI are aggregated based on where the chemical release or waste transfer originate from (i.e., to the TRI reporting facility); results selected for a city or zone improvement plan (ZIP) code include any releases or transfers from TRI-reporting facilities in that city or ZIP code, even if the ultimate chemical release or potential impacts that result occur in another city or ZIP code. RSEI also produces Geographic Microdata results, which aggregate the results based on where the chemical release and potential impacts may occur geographically. The RSEI Geographic Microdata page provides more information and instructions on downloading the Geographic Microdata.
For more information on each kind of result, see understanding RSEI results.
You may separately download the supporting information, including the RSEI methodology document, the toxicity weighting spreadsheet, the physicochemical data spreadsheet, and the technical appendices on the RSEI documentation and help page. EasyRSEI online help is also available.
Review how RSEI should be used.
What is new in RSEI Version 2.3.12
Each new version of RSEI incorporates the latest TRI data, as well as changes to the RSEI input data and the methodology used to process the data and present the results. The following changes were made in Version 2.3.12:
- Includes TRI reporting years 1988-2022.
- Toxicity weights have been updated with the most recent toxicity data.
- Stack parameters have been updated. Data from the 2020 NEI is used along with the 2005, 2008, 2011, 2014, and 2017 NEI.
- Census data from the 2020 U.S. decennial census is now used to create population estimates at the RSEI grid-cell level, in addition to decennial census data from 1990, 2000, and 2010.
