Office of Land and Emergency Management Program Benefits
The Office of Land and Emergency Management in partnership with other federal agencies, states, tribes, local governments, and communities strives to preserve land and clean up communities to create a safer environment for all Americans. Learn more about the impacts of OLEM’s work in the following areas:
- Protecting Human Health & the Environment
- Leveraging Economic Opportunities and Jobs and Mitigating Climate Change
- Working Towards a Sustainable Future
- Working with Partners to Prevent Hazardous Releases
- Cleaning up Contamination at Sites in Communities across the United States
Protecting Human Health & the Environment
- Superfund Cleanup Reduces Blood Lead Levels in Children : Results from an analysis of over one million children’s blood lead levels measurements from across six states over two decades indicate that cleanup at lead contaminated Superfund sites lowered the risk of elevated blood lead levels for children living within 2 kilometers of the sites by 13 to 26 percent.
- Superfund Cleanup Improves Infant Health : Superfund cleanups reduces the incidence of congenital anomalies in infants of mothers living within 2 kilometers of a site, by roughly 20 percent to 25 percent.
- Underground Storage Tanks (UST) Prevention Program Protects Groundwater: Strong UST prevention programs have decreased confirmed releases at sites by almost 40 percent over the last 15 years; helping to protect groundwater – the source of drinking water for nearly half of the United States.
- Responding to Emergencies: Every year, more than 30,000 emergencies involving the release (or threatened release) of oil and hazardous substances are reported in the United States. EPA works with other federal agencies, state and local responders to eliminate danger to the public.
Leveraging Economic Opportunities and Jobs and Mitigating Climate Change
- Cleanup Increases Housing Property Values: Peer reviewed studies have found that residential properties near Superfund and brownfields sites increased in value by 18.7 percent to 24.4 percent when a Superfund site was deleted from the National Priorities List (NPL) and 5 percent to 15.2 percent as a result of brownfields cleanup. Results of recent studies suggest large, positive and statistically significant impacts when as federal facility site is deleted from the NPL and that when a high-profile underground storage tank release is cleaned up average property prices rebound fully. And, new studies have found that cleanups increased home prices within the immediate Census tract of a RCRA Corrective Action (CA) site by as much as 11%.
- Cleanup Increases Local Tax Revenue: Analyzing data near 48 brownfields, we find an estimated $29 to $73 million in additional tax revenue for local governments in a single year after cleanup—2 to 6 times more than the $12.4 million EPA contributed to the cleanup of those brownfields.
- Cleanup Creates Reuse Opportunities and Jobs: Brownfields has leveraged more than 278,791 jobs and $41 billion in cleanup and redevelopment. An average of 13.9 jobs is leveraged per $100,000 of EPA funds expended. As of 2020 approximately 1,000 Superfund sites are currently in reuse, which is more than half the number of sites on Superfund’s National Priorities List. EPA has data on more than 10,253 businesses at 671 of these sites. In 2022 alone, these businesses generated $74.1billion in sales, which is more than four times the amount EPA has spent at these sites. These businesses employed more than 236,000 people who earned a combined income of over $18.6 billion.
- RCRA Sustainable Materials Management (SMM) Program Addresses Climate Change, Creates Jobs and Increases Tax Revenue: The Ellen MacArthur Foundation reported that applying circular economy strategies in five key materials (cement, aluminum, steel, plastics, and food) can achieve reductions in GHG emissions – 9.3 billion metric tons of carbon dioxide equivalent in 2050 globally – equivalent to cutting current emissions from all transport to zero. America’s recycling and reuse activities, a key part of EPA’s SMM approach, accounted for 681,000 jobs, produced $37.8 billion in wages and generated $5.5 billion in tax revenues in 2012. This equates to 1.17 jobs for every 1,000 tons of materials recycled. EPA’s SMM program also encourages the beneficial use of coal ash as a replacement for cement in concrete to reduce GHG emissions and improve the strength and durability of concrete.
Working Towards a Sustainable Future
- RCRA Addresses 2.96 Billion Tons of Solid, Industrial, and Hazardous Waste a Year: Under RCRA, EPA and the states manage the safe disposal of 2.96 billion tons of solid, industrial, and hazardous waste every year. This includes protective standards for the roughly 60,000 facilities in the U.S. that annually generate and manage over 30 to 40 million tons of hazardous waste. For data analysis and visualizations using U.S. EPA Hazardous Waste Data see the RCRAInfo Web Data Portal.
-
RCRA Sustainable Materials Management Program Diverts Waste from Entering Landfills and Incinerators and Helps Mitigate Climate Change: EPA has a broad vision to help the nation address the full impacts of materials on our communities and has set out a transformative vision for our waste management system – one that is inclusive, more equitable, and reflects the urgency of the climate crisis – by releasing a series of strategies that will be dedicated to building a circular economy for all. The National Recycling Strategy focuses on advancing the national municipal solid waste recycling system to create a stronger, more resilient, and cost-effective domestic recycling system. The National Strategy for Reducing Food Loss and Waste and Recycling Organics lays out objectives to prevent the loss and waste of food and increase recycling of organic materials, reduce greenhouse gas emissions, save households and businesses money, and build cleaner, healthier communities. EPA finalized the National Strategy to Prevent Plastic Pollution, which provides an ambitious, equitable approach to reducing and recovering plastics and other materials, as well as preventing plastic pollution from harming human health and the environment.
Working with Partners to Prevent Releases
- RCRA’s Permitting Program Protects People: RCRA Permitting Program serves to protect the 5.3 million people living within a mile of hazardous waste facilities by maintaining permits to protect human health and the environment for 6,700 hazardous waste units at 1,300 permitted facilities.
- Risk Management Plan Program Protects Communities Located Near 12,300 Facilities: These facilities contain the largest stockpiles of highly toxic and flammable chemicals in the United States and report on average about 234 incidents a year resulting in deaths, injuries, or significant property damage.
- Emergency Planning and Community Right-to-Know Act Program Assists Communities in Emergency Planning for Over 90,000 Facilities: OLEM provides guidance to state and local response organizations in developing emergency response plans for hazardous substances at facilities in more than 3,000 local emergency planning districts.
- Underground Storage Tanks Standards Prevent Potentially Dangerous and Costly Releases at USTs: EPA sets standards for approximately 537,700 USTs found in communities across the United States.
- Spill Prevention, Control and Countermeasure Plans Rule Helps Prevent Oil Spills at Over 550,400 Facilities: Approximately 3,821 of these facilities are required to have a Facility Response Plan because a discharge of oil could cause substantial harm to the environment.
Cleaning up Contamination at Sites in Communities across the United States
Office of Land and Emergency Management's Superfund sites, Resource Conservation and Recovery Act Corrective Action facilities and Brownfields exist in thousands of communities across the United States. Many of these communities are economically distressed, underserved and overburdened. To help understand who may benefit from our cleanup work, the Environmental Protection Agency analyzed data on the population living near to these sites
A description of the methodology is provided below. Using data from the U.S. Census’s American Community Survey, EPA estimated that approximately 213 million people live within three miles of a Superfund remedial site 1, RCRA Corrective Action facility or Brownfields site, roughly 64 percent of the U.S. population, including 65 percent of all children in the U.S. under the age of five. 2

While there is no single way to characterize communities located near our sites, this population is on average more minority, lower income, more linguistically isolated and less likely to have a high school education than the overall U.S. population. As a result, these communities may have fewer resources with which to address concerns about their health and environment.
OLEM also works with states, territories, tribes and industry to protect the environment and human health from potential releases at Underground Storage Tank facilities. The greatest potential threat from a leaking UST is contamination of groundwater, the source of drinking water for nearly half of all Americans. Approximately 94 percent of the U.S. population lives within 3 miles of an active UST facility, and 74 percent of the U.S. population lives within 3 miles of an open LUST release. The population living closest (within ¼ mile) to these USTs and LUSTs are on average more minority, lower income, more linguistically isolated and less likely to have a high school education then the overall U.S. population.3
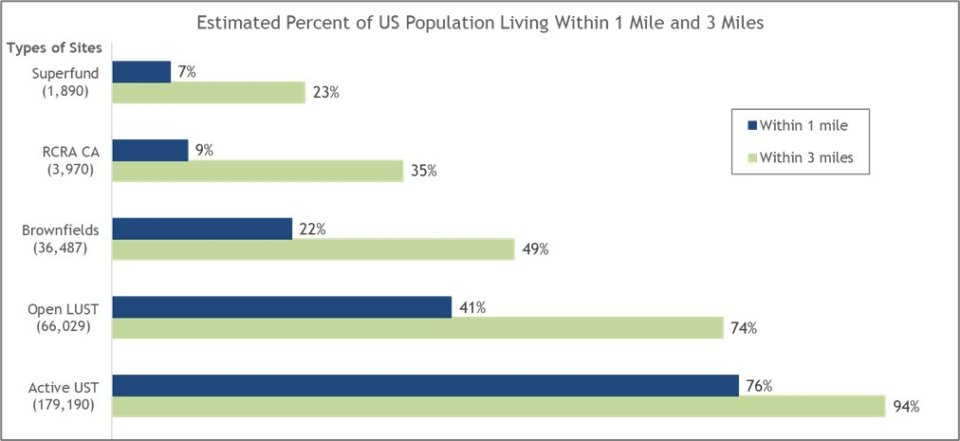
Note: Superfund includes Remedial and Federal Facility final, proposed and deleted NPL sites, as well as non-NPL Superfund Alternative Agreement sites.
Methodology
Modeled Site Boundaries: Latitude and longitude coordinates were used to map site locations. Actual boundaries were available for 1,879 of the 1,890 Superfund sites. Brownfield, RCRA and the remaining Superfund sites were modeled as circles based on site acreage around each site’s latitude and longitude coordinates. Open LUST releases and active UST facilities were modeled as points because acreages were unavailable. Site data used included:
- Superfund sites from SEMS as of FY 2023 and site boundary data updated in 2024 by SEGS
- Brownfields sites from ACRES as of FY 2023
- RCRA CA facilities from RCRAInfo as of FY 2023
- Active UST facilities and open LUST releases from UST Finder, from states as of 2018-2019, from Tribal Lands as of 2023, and U.S. territories as of 2020-2021
- Superfund Removal sites as of FY2019-FY2023
Mapped Buffers Around Site Boundaries: Buffers of varying distance were drawn from the site location. For all sites, a 1-mile buffer and a 3-mile buffer was used. For Brownfields, an additional ½-mile buffer was analyzed, and for active UST facilities and open LUST releases an additional ¼-mile buffer was analyzed.
Estimated Population Near to Sites: Next 2020 Census block centroids were layered over the site boundaries and if the census block centroid fell within the site buffer, the population of that block was included in the population estimate. Census blocks that fell within more than one site’s buffer (i.e., sites were located near each other) were only counted once. Population characteristic data from the American Community Survey 5-Year Data (2018-2022) was not available for census blocks but was available for block groups. To calculate the block population characteristics, the population percentage of the block within the block group was calculated and then that weight was applied to the respective block group characteristic of interest to estimate a value for the block.
Comparison: The near site population estimates were compared to the overall U.S. population to identify differences in characteristics.
Limitations: Data analyzed here takes a national look at select characteristics of the population in communities surrounding our sites. While some of the data point to possible environmental justice concerns in these communities, this is not a full environmental justice analysis. More site-specific information is available in EJScreen, where a more comprehensive environmental justice analysis can be completed. EJScreen is EPA's environmental justice mapping and screening tool that provides EPA with a nationally consistent dataset and approach for combining environmental and socioeconomic indicators. Note also that proximity to a site does not necessarily represent risk of adverse health effects. The risk of exposure to contamination varies significantly across all sites. Lastly, these estimates were made using the best available information but there are some limitations. For all RCRA Corrective Action and Brownfield sites, modelled site boundaries based on a latitude and longitude coordinate location and acreage were used. Actual boundaries were used for a subset of 1,879 of 1,890 Superfund sites. Only latitude and longitude coordinates were used for active UST facilities and open LUST releases. Another limiting factor is that data on the population were at the census block level and the estimates were made based on whether the census block centroid was within the distance buffer, which could underestimate the population in some cases and overestimate it in others.
Superfund Sites: Estimated Nearby Population and their Characteristics
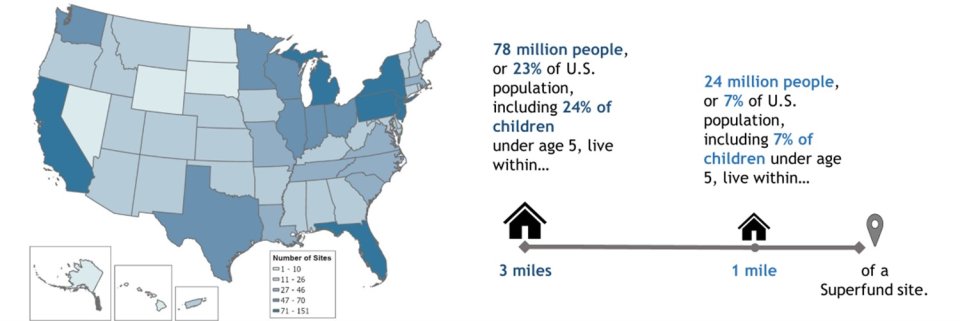
Superfund sites exist in thousands of communities across the United States. Many of these sites are in economically distressed, underserved and overburdened communities. EPA’s Superfund program is responsible for cleaning up some of the nation’s most contaminated land and responding to environmental emergencies, oil spills and natural disasters. To protect public health and the environment, the Superfund program focuses on making a visible and lasting difference in communities, ensuring that people can live and work in healthy, vibrant places. To help understand who may benefit from EPA’s Superfund Program, the agency used American Community Survey 2022 5-Year Data on population and FY 2022 Superfund site locations to estimate the population living within 1 mile and within 3 miles of the sites and their characteristics. These sites include Superfund and Federal Facilities final, deleted and proposed National Priorities List sites as well as non-NPL Superfund Alternative Agreement sites. The analysis included 1,890 Superfund sites.
Approximately 78 million people live within 3 miles of a Superfund site (roughly 23% of the U.S. population), including 24% of children under age 5. While there is no single way to characterize communities located near our sites, the population living within 3 miles of a Superfund site is on average more minority, lower income, more linguistically isolated and less likely to have a high school education than the overall U.S. population. This is also true for those approximately 24 million people living within 1 mile of a Superfund site.
Estimated average characteristics within 1 mile and 3 miles of a Superfund site versus in the total U.S. population
| Race | Within 1 mile | Within 3 miles | U.S. Population |
|---|---|---|---|
| White | 57.8% | 57.7% | 65.7% |
| Black | 12.2% | 14.5% | 12.4% |
| Asian | 8.8% | 8.0% | 5.7% |
| Native American | 0.8% | 0.7% | 0.8% |
| Hawaiian/Pacific Islander | 0.3% | 0.3% | 0.2% |
| Other | 20.0% | 18.9% | 15.2% |
| Ethnicity | Within 1 mile | Within 3 miles | U.S. Population |
|---|---|---|---|
| Hispanic (any race) | 25.4% | 24.2% | 19.4% |
| Non-Hispanic (any race) | 74.6% | 75.8% | 80.6% |
| Minority | 50.8% | 50.6% | 41.7% |
| Income | Within 1 mile | Within 3 miles | U.S. Population |
|---|---|---|---|
| Households below the poverty level | 14.0% | 13.8% | 12.7% |
| Households with incomes of at least two times the poverty level | 68.7% | 69.4% | 70.8% |
| Education | Within 1 mile | Within 3 miles | U.S. Population |
|---|---|---|---|
| Less than a high school education | 12.7% | 12.3% | 11.0% |
| Linguistically isolated | Within 1 mile | Within 3 miles | U.S. Population |
|---|---|---|---|
| Linguistically isolated households | 6.8% | 6.6% | 4.8% |
| Age | Within 1 mile | Within 3 miles | U.S. Population |
|---|---|---|---|
| Under 5 years of age | 5.8% | 5.8% | 5.7% |
| Under 18 years of age | 21.2% | 21.6% | 22.1% |
| Over 64 years of age | 14.6% | 15.1% | 16.6% |
Federal Facility Superfund Sites: Estimated Nearby Population and their Characteristics
Federal Facility Superfund sites exist in many communities across the United States. Many of these sites are in economically distressed, underserved and overburdened communities. The Federal Facilities Restoration and Reuse Office's mission is to facilitate faster, more effective and less costly cleanup and reuse of federal facilities while ensuring protection of human health and the environment. To help describe who may benefit from EPA’s Federal Facility Superfund Program, the agency used American Community Survey 2022 5-Year Data on populations and FY 2023 Federal Facility Superfund sites to estimate and summarize the characteristics of the population living within 1 mile and within 3 miles of sites. This analysis included 177 Federal Facility Superfund sites.
Approximately 13 million people live within 3 miles of a Federal Facility Superfund site (roughly 4% of the U.S. population), including 4% of children under age 5. While there is no single way to characterize communities located near these sites, the population living within 3 miles of a Federal Facility Superfund site is on average more minority than the overall U.S. population. This is also true for those approximately 3 million people living within 1 mile of a Federal Facility Superfund site.
Estimated average population characteristics within 1 mile and 3 miles of a Federal Facility Superfund site versus in the total U.S. population
| Race | Within 1 mile | Within 3 miles | U.S. Population |
|---|---|---|---|
| White | 53.9% | 54.6% | 65.7% |
| Black | 14.2% | 15.4% | 12.4% |
| Asian | 11.2% | 10.3% | 5.7% |
| Native American | 0.9% | 0.8% | 0.8% |
| Hawaiian/Pacific Islander | 1.3% | 0.8% | 0.2% |
| Other | 18.6% | 18.1% | 15.2% |
| Ethnicity | Within 1 mile | Within 3 miles | U.S. Population |
|---|---|---|---|
| Hispanic (any race) | 20.0% | 20.0% | 19.4% |
| Non-Hispanic (any race) | 80.0% | 80.0% | 80.6% |
| Minority | 52.8% | 51.9% | 41.7% |
| Income | Within 1 mile | Within 3 miles | U.S. Population |
|---|---|---|---|
| Households below the poverty level | 11.4% | 11.5% | 12.7% |
| Households with incomes of at least two times the poverty level | 72.1% | 73.1% | 70.8% |
| Education | Within 1 mile | Within 3 miles | U.S. Population |
|---|---|---|---|
| Less than a high school education | 10.0% | 10.2% | 11.0% |
| Linguistically isolated | Within 1 mile | Within 3 miles | U.S. Population |
|---|---|---|---|
| Linguistically isolated households | 4.4% | 5.1% | 4.8% |
| Age | Within 1 mile | Within 3 miles | U.S. Population |
|---|---|---|---|
| Under 5 years of age | 6.8% | 6.2% | 6.2% |
| Under 18 years of age | 23.3% | 22.4% | 22.4% |
| Over 64 years of age | 12.7% | 14.2% | 14.2% |
Superfund Removal Actions: Estimated Nearby Population and their Characteristics
The Superfund Emergency Response and Removal Program functions as the backbone federal response to many emergency events; provides response support to state, local, tribal and potentially responsible parties when their response capabilities are exceeded; and manages risks to human health and the environment. Removal actions are typically immediate short-term responses intended to protect people from threats posed by hazardous waste sites. Removal actions occur in many communities across the United States. Many of these removal actions are in economically distressed, underserved and overburdened communities. To help describe who may benefit from EPA’s Superfund Removal Program, the agency used American Community Survey 5-Year Data on populations and FY 2019 to FY 2023 Removal sites to summarize the population living within 1 mile and within 3 miles of these sites. The sites include both “removal only” sites and remedial National Priority List sites with removal actions. This analysis included the 1,070 Superfund Removal Action sites that occurred between FY 2019 and FY 2023.
Approximately 40 million people live within 3 miles of a Superfund Removal Action site that occurred between FY2019 and FY2023 (roughly 12% of the U.S. population), including 12% of children under age 5. While there is no single way to characterize communities located near these sites, the population living within 3 miles of these Superfund Removal Action sites is on average more minority, lower income, more linguistically isolated and less likely to have a high school education than the overall U.S. population. This is also true for those approximately 7 million people living within 1 mile of these Superfund Removal Action sites.
Estimated average characteristics within 1 mile and 3 miles of a Superfund Removal Action site (FY 2019 – FY 2023) versus in the total U.S. population
| Race | Within 1 mile | Within 3 miles | U.S. Population |
|---|---|---|---|
| White | 54.6% | 54.2% | 65.7% |
| Black | 18.9% | 18.8% | 12.4% |
| Asian | 6.2% | 7.4% | 5.7% |
| Native American | 0.7% | 0.7% | 0.8% |
| Hawaiian/Pacific Islander | 0.2% | 0.2% | 0.2% |
| Other | 19.3% | 18.8% | 15.2% |
| Ethnicity | Within 1 mile | Within 3 miles | U.S. Population |
|---|---|---|---|
| Hispanic (any race) | 24.1% | 23.6% | 19.4% |
| Non-Hispanic (any race) | 75.9% | 76.4% | 80.6% |
| Minority | 53.2% | 53.5% | 41.7% |
| Income | Within 1 mile | Within 3 miles | U.S. Population |
|---|---|---|---|
| Households below the poverty level | 16.8% | 15.5% | 12.7% |
| Households with incomes of at least two times the poverty level | 63.9% | 66.6% | 70.8% |
| Education | Within 1 mile | Within 3 miles | U.S. Population |
|---|---|---|---|
| Less than a high school education | 13.7% | 13.1% | 11.0% |
| Linguistically isolated | Within 1 mile | Within 3 miles | U.S. Population |
|---|---|---|---|
| Linguistically isolated Households | 6.7% | 6.4% | 4.8% |
| Age | Within 1 mile | Within 3 miles | U.S. Population |
|---|---|---|---|
| Under 5 years of age | 5.8% | 5.9% | 5.7% |
| Under 18 years of age | 21.2% | 21.5% | 22.1% |
| Over 64 years of age | 14.0% | 14.5% | 16.6% |
Brownfields: Estimated Nearby Population and their Characteristics
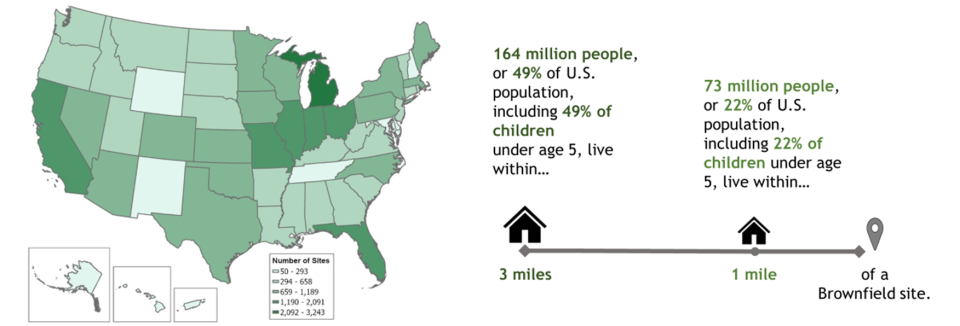
Brownfields sites exist in thousands of communities across the United States. Many of these sites are in economically distressed, underserved and overburdened communities. EPA’s Brownfields Program provides grants and technical assistance to communities, states, Tribes, and others to assess, safely clean up and sustainably reuse contaminated properties. To help describe who may benefit from EPA’s Brownfields Program, the agency used American Community Survey 5-Year Data on populations and Brownfields as of the end of FY2023 to summarize the population living within 3, 1 and ½ mile(s) of Brownfield sites that received EPA funding. The analysis included 36,487 Brownfield sites that received EPA funding.
Approximately 164 million people live within 3 miles of a Brownfields site (roughly 49% of the U.S. population), including 49% of children under age 5. While there is no single way to characterize communities located near these sites, the population living within 3 miles of a Brownfields site is on average more minority, lower income, more linguistically isolated and less likely to have a high school education when compared to the overall U.S. population. This is also true for those approximately 73 million people living within 1 mile and the 37 million people living with ½ mile of a Brownfields site.
Estimated average characteristics within 1 mile and 3 miles of a Brownfields site versus in the total U.S. population
| Race | Within ½ mile | Within 1 mile | Within 3 miles | U.S. Population |
|---|---|---|---|---|
| White | 53.7% | 55.3% | 59.6% | 65.7% |
| Black | 20.6% | 19.1% | 15.6% | 12.4% |
| Asian | 5.5% | 5.8% | 6.4% | 5.7% |
| Native American | 1.1% | 1.0% | 0.9% | 0.8% |
| Hawaiian/Pacific Islander | 0.2% | 0.2% | 0.2% | 0.2% |
| Other | 18.8% | 18.5% | 17.3% | 15.2% |
| Ethnicity | Within ½ mile | Within 1 mile | Within 3 miles | U.S. Population |
|---|---|---|---|---|
| Hispanic (any race) | 23.5% | 23.4% | 22.0% | 19.4% |
| Non-Hispanic (any race) | 76.5% | 76.6% | 78.0% | 80.6% |
| Minority | 53.9% | 52.5% | 48.2% | 41.7% |
| Income | Within ½ mile | Within 1 mile | Within 3 miles | U.S. Population |
|---|---|---|---|---|
| Households below the poverty level | 19.7% | 18.0% | 14.8% | 12.7% |
| Households with incomes of at least two times the poverty level | 59.1% | 61.8% | 67.2% | 70.8% |
| Less than a high school education | 15.1% | 14.3% | 12.4% | 11.0% |
| Linguistically isolated | Within ½ mile | Within 1 mile | Within 3 miles | U.S. Population |
|---|---|---|---|---|
| Linguistically isolated households | 6.7% | 6.5% | 5.9% | 4.8% |
| Age | Within ½ mile | Within 1 mile | Within 3 miles | U.S. Population |
|---|---|---|---|---|
| Under 5 years of age | 5.8% | 5.8% | 5.8% | 5.7% |
| Under 18 years of age | 21.0% | 21.2% | 21.5% | 22.1% |
| Over 64 years of age | 14.4% | 14.8% | 15.8% | 16.6% |
RCRA Corrective Action Facilities: Estimated Nearby Population and their Characteristics
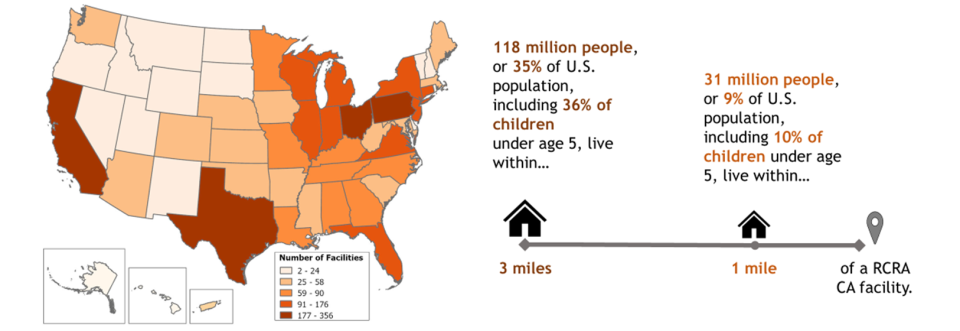
RCRA Corrective Action facilities exist in thousands of communities across the United States. Many of these facilities are in economically distressed underserved and overburdened communities. To help describe who may benefit from EPA’s RCRA Corrective Action Program cleanup work, the agency used American Community Survey 5-Year data on population and FY 2023 RCRA Corrective Action to summarize the population living within 3 miles and within 1 mile of RCRA CA facilities. The analysis included 3,970 RCRA Corrective Action Facilities.
Approximately 118 million people live within 3 miles of a RCRA Corrective Action facility (roughly 35% of the U.S. population), including 36% of children under age 5. While there is no single way to characterize communities located near these facilities, the population living within 3 miles of a RCRA Corrective Action facility is on average more minority, lower income, more linguistically isolated and less likely to have a high school education than the overall U.S. population. This is also true for those approximately 31 million people living within 1 mile a RCRA Corrective Action facility.
Estimated average characteristics within 1 mile and 3 miles of a RCRA Corrective Action Facility versus in the total U.S. population
| Race | Within 1 mile | Within 3 miles | U.S. Population |
|---|---|---|---|
| White | 57.5% | 57.7% | 65.7% |
| Black | 15.6% | 15.6% | 12.4% |
| Asian | 6.8% | 7.6% | 5.7% |
| Native American | 0.7% | 0.6% | 0.8% |
| Hawaiian/Pacific Islander | 0.2% | 0.2% | 0.2% |
| Other | 19.1% | 18.2% | 15.2% |
| Ethnicity | Within 1 mile | Within 3 miles | U.S. Population |
|---|---|---|---|
| Hispanic (any race) | 24.9% | 23.5% | 19.4% |
| Non-Hispanic (any race) | 75.1% | 76.5% | 80.6% |
| Minority | 51.5% | 50.6% | 41.7% |
| Income | Within 1 mile | Within 3 miles | U.S. Population |
|---|---|---|---|
| Households below the poverty level | 15.9% | 14.4% | 12.7% |
| Households with incomes of at least two times the Poverty level | 15.9% | 14.4% | 12.7% |
| Education | Within 1 mile | Within 3 miles | U.S. Population |
|---|---|---|---|
| Less than a high school education | 13.3% | 12.3% | 11.0% |
| Linguistically isolated | Within 1 mile | Within 3 miles | U.S. Population |
|---|---|---|---|
| Linguistically isolated Households | 6.4% | 6.3% | 4.8% |
| Age | Within 1 mile | Within 3 miles | U.S. Population |
|---|---|---|---|
| Under 5 years of age | 6.0% | 5.9% | 5.7% |
| Under 18 years of age | 21.8% | 21.6% | 22.1% |
| Over 64 years of age | 14.1% | 15.0% | 16.6% |
Active Underground Storage Tank Facilities: Estimated Nearby Population and their Characteristics
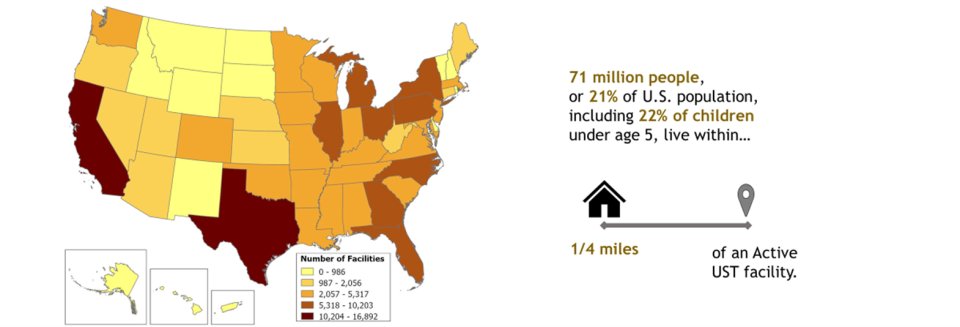
Underground Storage Tank facilities exist in thousands of communities across the United States. Many of these facilities are in economically distressed, underserved and overburdened communities. To help describe who may benefit from EPA’s UST Program, the agency used American Community Survey 2022 5-Year data on population and UST facilities from states as of 2018-2019 and from Tribal lands and U.S. territories as of 2020-2021 to summarize the population living within 3, 1, and ¼ mile(s) of active UST facilities. The analysis included 179,190 Active UST facilities.
Approximately 255 million people live within 1-mile of an active UST facility (roughly 76% of the U.S. population), including 78% of children under age 5. While there is no single way to characterize communities located near these facilities, the population living within 1 mile of an active UST facility is on average more minority than the overall U.S. population. While those 71 million people living closest (i.e., within ¼ mile of a UST facility) are on average more minority, lower income, more linguistically isolated and less likely to have a high school education than the overall U.S. population.
Estimated average characteristics within 3, 1, and ¼ mile(s) of an active Underground Storage Tank facility versus in the total U.S. population
| Race | Within ¼ mile | Within 1 mile | Within 3 miles | U.S. Population |
|---|---|---|---|---|
| White | 55.1% | 61.8% | 65.0% | 65.7% |
| Black | 16.5% | 14.2% | 12.9% | 12.4% |
| Asian | 7.7% | 6.6% | 6.0% | 5.7% |
| Native American | 0.8% | 0.7% | 0.7% | 0.8% |
| Hawaiian/Pacific Islander | 0.2% | 0.2% | 0.2% | 0.2% |
| Other | 19.7% | 16.5% | 15.2% | 15.2% |
| Ethnicity | Within ¼ mile | Within 1 mile | Within 3 miles | U.S. Population |
|---|---|---|---|---|
| Hispanic (any race) | 25.5% | 21.2% | 19.2% | 19.4% |
| Non-Hispanic (any race) | 74.5% | 78.8% | 80.8% | 80.6% |
| Minority | 53.7% | 46.1% | 42.2% | 41.7% |
| Income | Within ¼ mile | Within 1 mile | Within 3 miles | U.S. Population |
|---|---|---|---|---|
| Households below the poverty level | 16.3% | 13.3% | 12.4% | 12.7% |
| Households with incomes of at least two times the poverty level | 64.2% | 69.7% | 71.3% | 70.8% |
| Education | Within ¼ mile | Within 1 mile | Within 3 miles | U.S. Population |
|---|---|---|---|---|
| Less than a high school education | 14.0% | 11.5% | 10.8% | 11.0% |
| Linguistically isolated | Within ¼ mile | Within 1 mile | Within 3 miles | U.S. Population |
|---|---|---|---|---|
| Linguistically isolated households | 7.3% | 5.0% | 4.4% | 4.8% |
| Age | Within ¼ mile | Within 1 mile | Within 3 miles | U.S. Population |
|---|---|---|---|---|
| Under 5 years of age | 5.9% | 5.8% | 5.8% | 5.7% |
| Under 18 years of age | 21.1% | 22.0% | 22.1% | 22.1% |
| Over 64 years of age | 14.8% | 15.8% | 16.3% | 16.6% |
Open Leaking Underground Storage Tank Releases: Estimated Nearby Population and their Characteristics
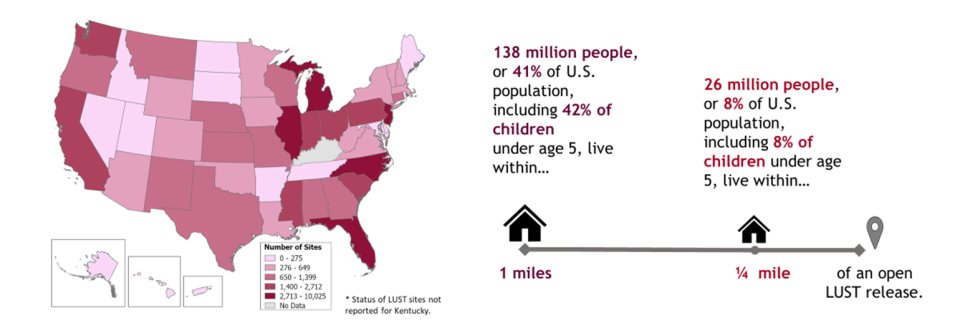
Open Leaking Underground Storage Tank releases exist in thousands of communities across the United States. Many of these releases are in economically distressed, underserved and overburdened communities. To help describe who may benefit from EPA’s UST Program, the agency used American Community Survey 5-Year data on population and LUST releases from states as of 2018-2019, from Tribal lands as of 2023 and U.S. territories as of 2020-2021 to summarize the population living within 3, 1, and ¼ mile(s) of open LUST facilities. The analysis included 66,029 open LUST releases. Note that LUST data for Kentucky was not included because data from KY did not allow for the distinction between open and closed LUST releases.
Approximately 138 million people live within 1 mile of an open LUST release (roughly 41% of the U.S. population), including 42% of children under age 5. While there is no single way to characterize communities located near these releases, the population living within 1 mile of an open LUST release is on average more minority, lower income, more linguistically isolated and less likely to have a high school education than the overall U.S. population. This is also true for those approximately 26 million people living within ¼ mile am open LUST release.
Estimated average characteristics within 3, 1, and ¼ mile(s) of an open Leaking Underground Storage Tank release versus in the total U.S. population
| Race | Within ¼ mile | Within 1 mile | Within 3 miles | U.S. Population |
|---|---|---|---|---|
| White | 54.6% | 59.0% | 62.4% | 65.7% |
| Black | 18.0% | 16.0% | 14.0% | 12.4% |
| Asian | 6.9% | 6.7% | 6.4% | 5.7% |
| Native American | 0.8% | 0.7% | 0.7% | 0.8% |
| Hawaiian/Pacific Islander | 0.2% | 0.2% | 0.2% | 0.2% |
| Other | 19.5% | 17.5% | 16.2% | 15.2% |
| Ethnicity | Within ¼ mile | Within 1 mile | Within 3 miles | U.S. Population |
|---|---|---|---|---|
| Hispanic (any race) | 25.3% | 22.4% | 20.9% | 19.4% |
| Non-Hispanic (any race) | 74.7% | 77.6% | 79.1% | 80.6% |
| Minority | 54.0% | 49.0% | 45.3% | 41.7% |
| Income | Within ¼ mile | Within 1 mile | Within 3 miles | U.S. Population |
|---|---|---|---|---|
| Households below the poverty level | 17.0% | 14.9% | 13.2% | 12.7% |
| Households with incomes of at least two times the poverty level | 63.3% | 66.9% | 70.0% | 70.8% |
| Education | Within ¼ mile | Within 1 mile | Within 3 miles | U.S. Population |
|---|---|---|---|---|
| Less than a high school education | 13.9% | 12.4% | 11.3% | 11.0% |
| Linguistically isolated | Within ¼ mile | Within 1 mile | Within 3 miles | U.S. Population |
|---|---|---|---|---|
| Linguistically isolated households | 7.8% | 6.2% | 5.4% | 4.8% |
| Age | Within ¼ mile | Within 1 mile | Within 3 miles | U.S. Population |
|---|---|---|---|---|
| Under 5 years of age | 5.7% | 5.8% | 5.7% | 5.7% |
| Under 18 years of age | 20.5% | 21.3% | 21.8% | 22.1% |
| Over 64 years of age | 14.9% | 15.9% | 16.3% | 16.6% |
-
Superfund sites include Remedial and Federal Facility final, proposed and deleted NPL sites, as well as non-NPL Superfund Alternative Agreement sites.
-
These estimates cover sites that have received EPA funding, not the entire universe of contaminated land across the country. Data includes: (1) site information as of the end of FY2023 from SEMS, ACRES and RCRAInfo and Superfund boundary data from SEGS updates from 2023; (2) population data from the U.S. Census’s American Community Survey 2022 5-Year Data; and (3) Superfund includes Remedial and Federal Facility final, deleted, and proposed National Priorities List (NPL) sites, as well as non-NPL Superfund Alternative Agreement sites.
- These estimates cover the known open LUST releases and active UST facility universe across the country. Data include: (1) site information from states as of 2018 -2019, from Tribal lands as of the end of 2023, and Puerto Rico as 2020-2021 from Office of Research and Development & Office of Underground Storage Tanks, UST Finder; (2) LUST data does not include KY; (3) population data from the U.S. Census’s American Community Survey 2022 5-Year Data.
