GHGRP Reported Data
For reporting year (RY) 2023, over 8,000 facilities and suppliers reported to the Greenhouse Gas Reporting Program (GHGRP). Among these reporters,
- 7,544 facilities in nine industry sectors reported direct emissions;
- Reported direct emissions totaled 2.58 billion metric tons carbon dioxide equivalent (CO2e);
- 995 suppliers of fossil fuels and industrial gases reported; and
- 81 facilities reported injecting CO2 underground (Subpart UU).
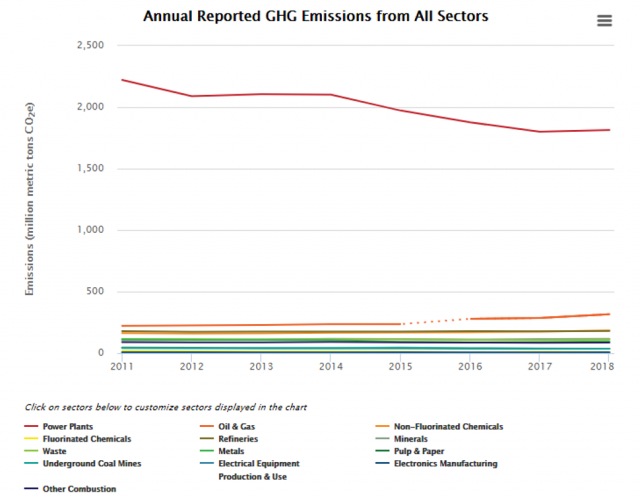
Figure 1: Direct GHG Emissions Reported by Sector (2023)
View this information in FLIGHT.
GHGRP Data Highlights Summary Sections
Greenhouse Gas Reporting Program Background
As directed by Congress, EPA’s Greenhouse Gas Reporting Program (GHGRP) collects annual greenhouse gas information from the top emitting sectors of the U.S. economy (Table 1). The GHGRP is the only dataset containing facility-level greenhouse gas (GHG) emissions data from large industrial sources across the United States. With 13 consecutive years of reporting for most sectors, GHGRP data are providing important new information on industrial emissions—showing variation in emissions across facilities within an industry, variation in industrial emissions across geographic areas, and changes in emissions over time at the sector and facility level. EPA is using this facility-level data to improve estimates of national greenhouse gas emissions in the U.S. Greenhouse Gas Inventory.
This document summarizes national industrial sector emissions and trends.
The GHGRP does not represent total U.S. GHG emissions, but provides facility level data for large sources of direct emissions, thus representing the majority of U.S. GHG emissions. The GHGRP data collected from direct emitters represent about half of all U.S. emissions. When including greenhouse gas information reported to the GHGRP by suppliers, emissions coverage reaches approximately 85–90% (See Figure 2). The Inventory of U.S. Greenhouse Gas Emissions and Sinks: 1990-2022 contains information on all GHG emissions sources and sinks in the United States.
Learn more about the differences between the Inventory and the GHGRP.
Figure 2: U.S. Greenhouse Gas Inventory and the Greenhouse Gas Reporting Program
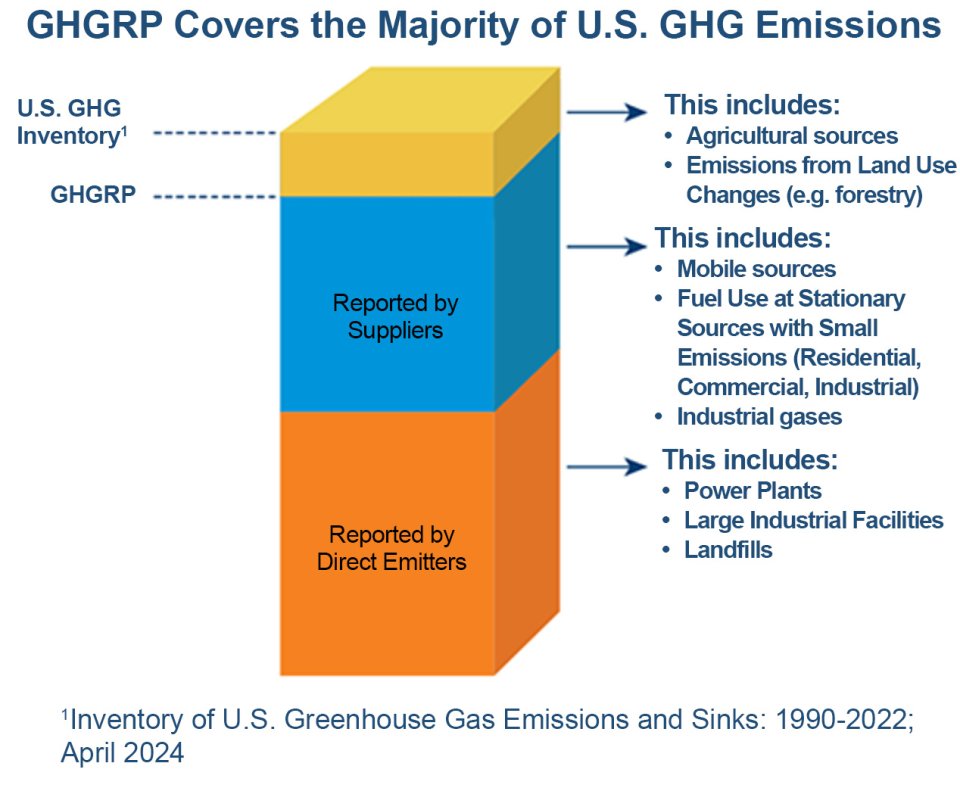
Suppliers report the quantity of GHGs that would be emitted if the fuels and industrial GHGs that they place into the economy each year are used/released. Reporting by suppliers helps account for the greenhouse gas emissions by the numerous low-emitting sources that are not required to report emissions under the GHGRP (e.g., mobile sources, residential sources). Learn more about suppliers and their 2023 reported data.
| Direct emitters | |
|---|---|
| Number of facilities reporting | 7,544 |
| Reported direct emissions (billion metric tons CO2e) | 2.578 |
| Suppliers of fuel and industrial gases | |
| Number of suppliers | 995 |
| Underground injection of carbon dioxide (Subpart UU) | |
| Number of carbon dioxide injection facilities | 81 |
GHGRP Calculation Methods Used
The GHGRP prescribes methodologies that must be used to determine GHG emissions from each source category. Reporters generally have the flexibility to choose among several methods to compute GHG emissions. The decision of which method to use may be influenced by the existing environmental monitoring systems in place and other factors. Reporters can change emission calculation methods from year to year and within the same year, as long as they meet the requirements for use of the method selected.
Additional information on the methodologies that reporters use to determine GHG emissions
Report Verification
All reports submitted to EPA are evaluated by electronic validation and verification checks. If potential errors are identified, EPA will notify the reporter, who can resolve the issue either by providing an acceptable response describing why the flagged issue is not an error or by correcting the flagged issue and resubmitting their annual GHG report.
Additional information describing EPA’s verification process in more details
For More Information
For more detailed information from each industrial sector, select an industrial sector from the left hand navigation menu.
Use FLIGHT to view maps of facility locations, obtain summary data for individual facilities, create customized searchers, and display search results graphically.
Downloadable spreadsheets containing summary data reported to the GHGRP from each reporter are available on the Data Downloads page.
All other publicly available data submitted to the GHGRP are available for download through Envirofacts.
The U.S. Greenhouse Gas Inventory contains information on all sources of GHG emissions and sinks in the United States from 1990 to 2022.
All GHG emissions data reflect the global warming potential (GWP) values from the Fourth Assessment Report (AR4) of the Intergovernmental Panel on Climate Change (Climate Change 2007: The Physical Science Basis. Contribution of Working Group I to the Fourth Assessment Report of the Intergovernmental Panel on Climate Change [Core Writing Team, Pachauri, R.K. and Reisinger, A. (eds)]. IPCC, Geneva, Switzerland, 2007). The AR4 values also can be found in the current version of Table A-1 in subpart A of 40 CFR part 98.

