Marine Water Quality
Updated June 2021 based on data available through December 2019.
- About Marine Water Quality
- What's Happening?
- Why Is It Important?
- Why Is It Happening?
- What's Being Done About It?
- Seven Things You Can Do To Help
- References
About Marine Water Quality
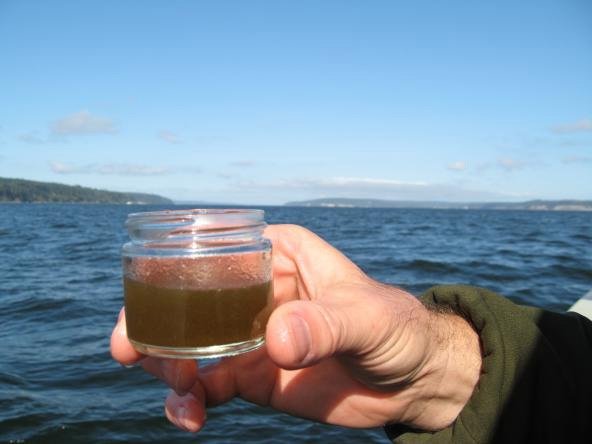
Marine water quality is fundamentally important for all plants and animals that depend on the Salish Sea. It affects the amount of phytoplankton that are present in the surface water, which is critical because phytoplankton naturally take in and lock up large amounts of free carbon and release oxygen to the environment. Marine water quality also influences the ability of fish and marine mammals to grow and reproduce.
Marine water quality affects people too. It affects us both directly when we go to a beach and indirectly when we enjoy the wildlife and scenery of the area. It also influences the quality and quantity of food that we can harvest from the ocean.
This indicator summarizes trends for dissolved oxygen in coastal water over time. It is a measure of the overall quality of marine waters in the Salish Sea. The Washington State Department of Ecology has also developed the Marine Water Condition Index as another way to track marine water quality in Puget Sound. It is presented here as a complementary measure of marine water quality.
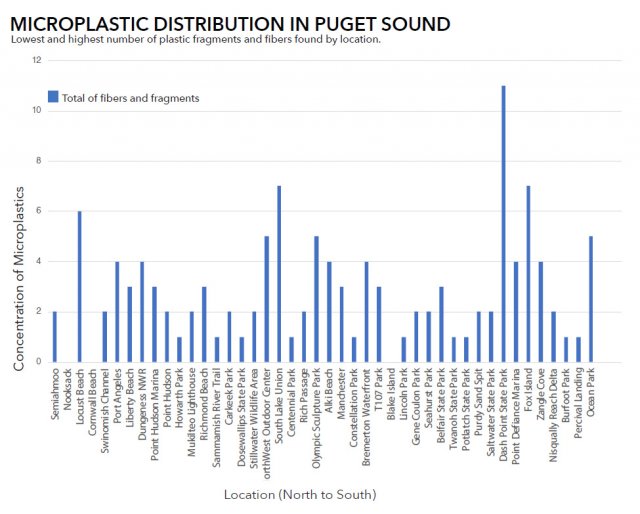
This indicator also introduces an emerging threat to marine water quality - both in the Salish Sea and across earth’s oceans - the increasing prevalence of microplastics.
What's Happening?
Dissolved oxygen levels in the Salish Sea have naturally risen and fallen over the past 400 years but the levels have been declining gradually and consistently over at least the last 70 years. It is not yet clear as to the full extent that human influence has had on the recent declines in Marine Water Quality, but the decline is making aquatic life more vulnerable to pollution and other types of impacts from people.
When dissolved oxygen is low, it means there is less oxygen available in the water to support aquatic life. Scientists use the term hypoxia to describe water conditions in which there is not enough oxygen to support aquatic organisms, either through acute impacts at more localized scales or more chronic stress over larger areas and longer periods of time. See the Washington Department of Ecology's Nitrogen in Puget Sound storymap to find out more about nutrient loads and hypoxia in Puget Sound.
Learn More About Hypoxia
In some areas of the Salish Sea, hypoxia naturally occurs in mid-to-late summer when water stratification is greatest. Water stratifies into layers when there are large temperature (and related density) differences between the top and the bottom of the water column. This temperature difference restricts oxygen in the surface water from naturally mixing with water near the bottom and leads to hypoxia in deeper waters. Climate change could lead to an increase in water stratification by further warming up the surface waters of the Salish Sea and this could lead to an increase in the number of hypoxic areas.
The impact of seasonal hypoxia has dramatically increased over the past few decades in some areas due to human-caused eutrophication from municipal and industrial wastewater discharges, fertilizer runoff and other nutrient sources including animal waste, failing septic systems in nearshore areas, and the degradation of natural nutrients in local watersheds. Eutrophication is an increase in nutrients in the water, which can lead to algal blooms. When the algae eventually die and sink to the bottom, bacteria and other organisms, consume them – a process that uses up available oxygen. There is concern that eutrophication and harmful algae blooms could have significant impacts in the future since wastewater flows into the Salish Sea are increasing over time as population growth in the region continues.
Watershed hydrology also strongly affects the residence time of water in some inlets and bays; when the region experiences droughts or periods of low baseflow the impacts from human nutrient inputs are exacerbated because estuarine circulation is dampened and these areas are not flushed as quickly.
Dissolved Oxygen Trends in Puget Sound
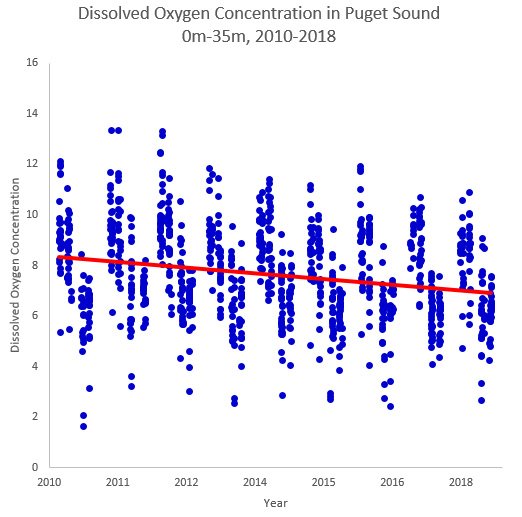
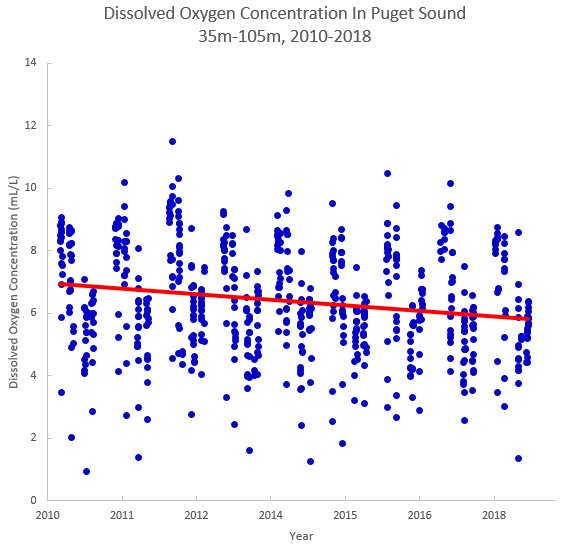
The two graphs below show dissolved oxygen data collected in Puget Sound between 2010 and 2018 at two depth intervals: 0-35m and 35-105m. At depths between 0-35m, the dissolved oxygen levels vary more widely due to oxygen exchange with both the atmosphere and biological processes. At depth, the dissolved oxygen levels are more stable.
The red line through each graph shows the estimated linear trend over time. The downward slope of these lines shows a negative trend in the oxygen concentration, which scientists also recorded from 2000-2009.
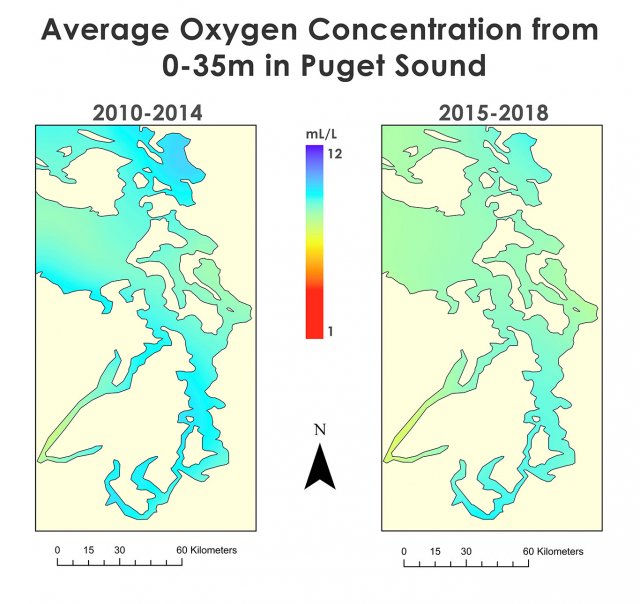
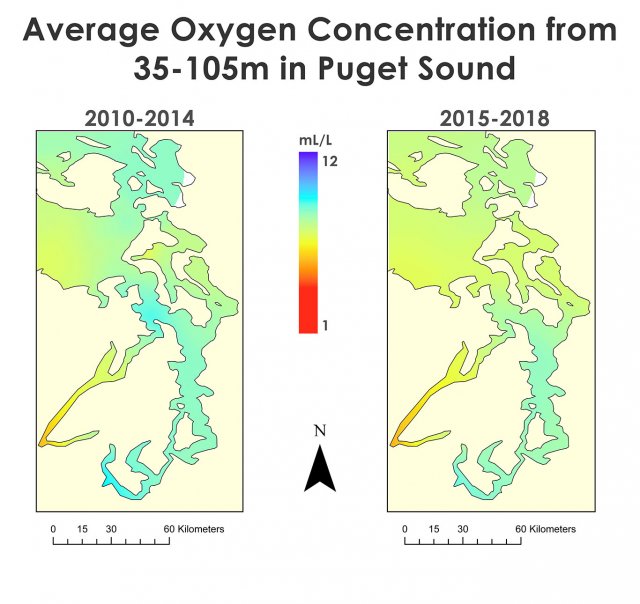
The maps below display a spatial interpolation of dissolved oxygen throughout the Puget Sound from 2010-2014 and from 2015-2018 at the two established depth intervals. The oxygen data range for the maps is from 3mL/L to 9 mL/L.
0-35 Meters
The downward slope of the red line in the first chart shows a decreasing trend for dissolved oxygen in the surface waters of Puget Sound. This is consistent with the decreasing trend in surface waters (0-35m) in the Strait of Georgia. It is also consistent with the decreasing trend that was documented in Puget Sound surface waters from 2000-2009.
35-105 Meters
The downward slope of the red line in the first chart shows a decreasing trend in dissolved oxygen in the intermediate waters of Puget Sound. This is consistent with the decreasing trend in intermediate waters (35-105m) in the Strait of Georgia. It is also consistent with the decreasing trend that was recorded in Puget Sound intermediate waters from 2000-2009.
Puget Sound Marine Water Condition Index
Scientists working in the Puget Sound have developed a Marine Water Condition Index that summarizes 12 different water quality measurements such as temperature, dissolved oxygen, and nutrients, into a single number score ranging from -50 to +50. Numbers greater than zero on the index represent improving water quality, while numbers less than zero represent decreasing water quality. By following the index over time, one can see whether overall water quality is improving or declining relative to the period from 1999-2008.
Dissolved Oxygen Trends in the Strait of Georgia
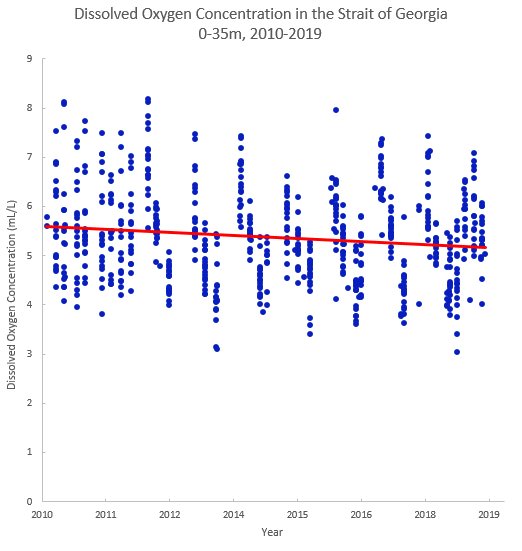
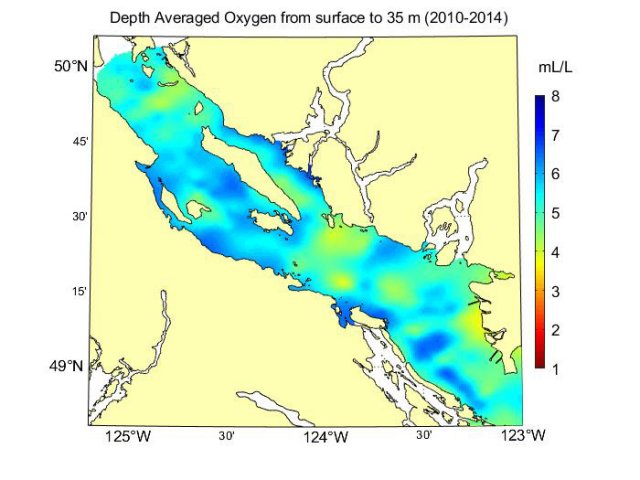
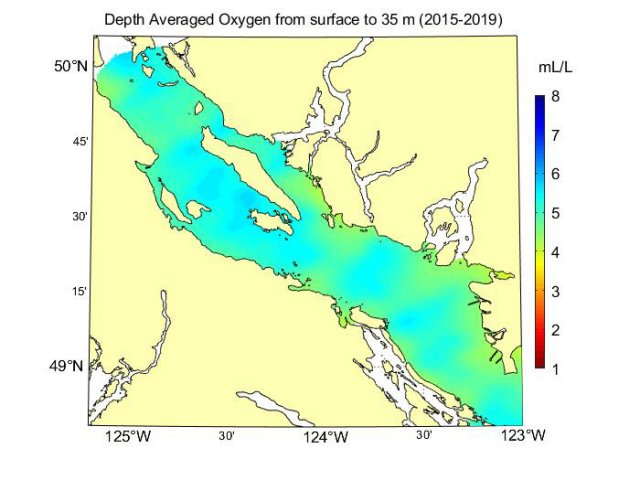
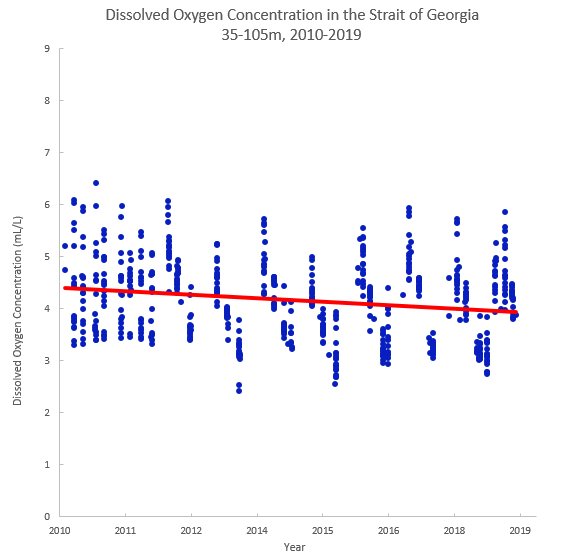
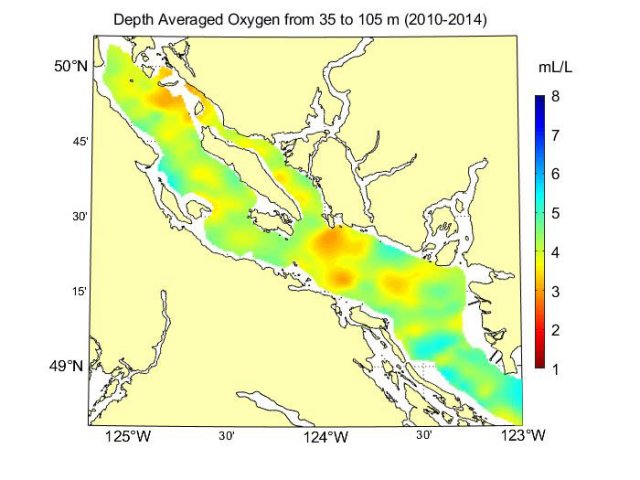
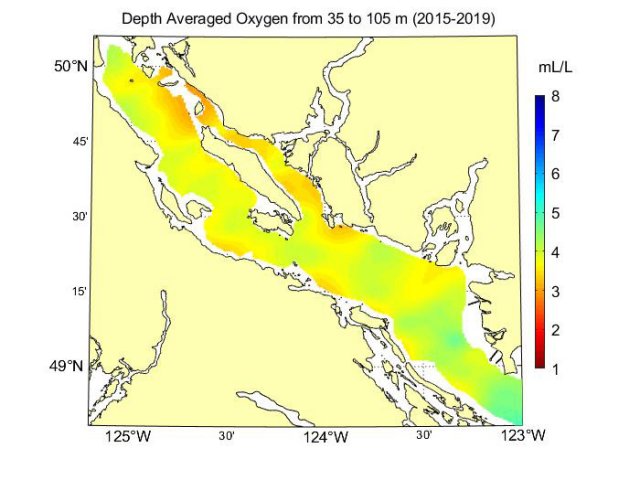
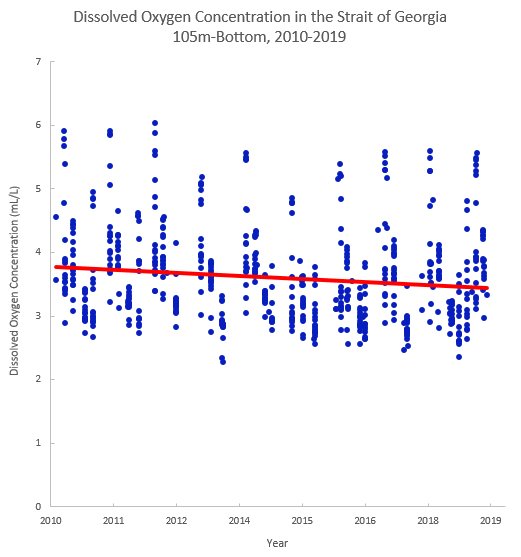
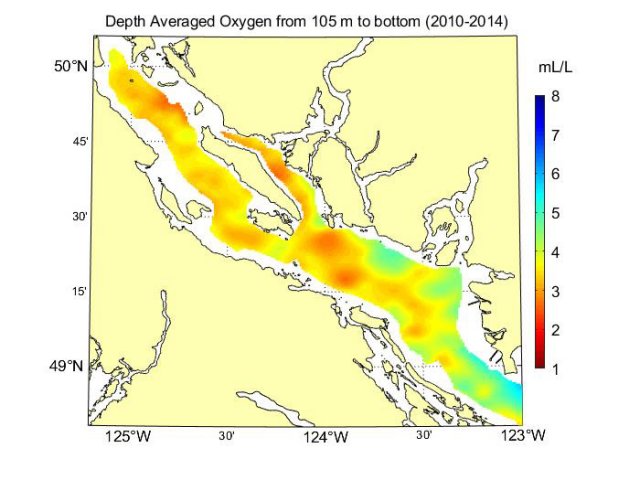
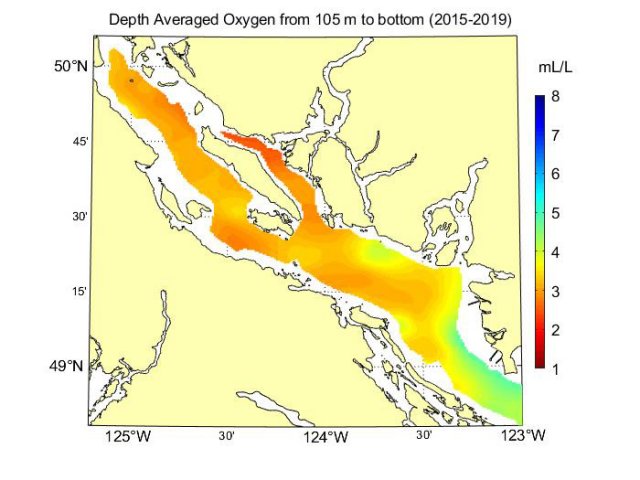
The charts below show dissolved oxygen data collected in the Strait of Georgia between 2010 and 2019 at three depth intervals: 0-35m, 35-105m, and 105m to the sea bottom. At depths between 0-35m, the dissolved oxygen levels vary more widely due to oxygen exchange with both the atmosphere and biological processes. At greater depths, the dissolved oxygen levels are more stable. The maps below display a spatial interpolation of dissolved oxygen throughout the Strait of Georgia from 2010-2014 and from 2015-2019 at the three established depth intervals. The oxygen data range for the maps is from 1 mL/L to 8 mL/L. The data used to create the charts and maps were quality controlled at the Institute of Ocean Sciences in Sidney, BC.
It is noteworthy that average dissolved oxygen measurements in the Strait of Georgia tend to be approximately 1.5-2mL/L lower than average dissolved oxygen measurements in Puget Sound, within the same depth profile. This phenomenon occurs due to several processes. First, the Strait of Georgia occasionally experiences a natural influx of low-oxygen Pacific water that flows over a sill at Boundary Pass at the southern end of the Strait. This influx spreads throughout the Strait and contributes to lower levels of dissolved oxygen. Second, Puget Sound often experiences vigorous vertical mixing due to strong tidal currents near the Admiralty Sill, and in the Tacoma Narrows, which leads to higher dissolved oxygen levels at depth. Finally, Puget Sound frequently experiences super-saturation of dissolved oxygen in the surface layer during the summer due to high primary productivity, which contributes to higher average dissolved oxygen levels at the surface.
0-35 Meters
The downward slope of the red line in the first chart reflects a decreasing trend for dissolved oxygen in surface waters in the Strait of Georgia. This is consistent with the decreasing trend found in Puget Sound surface waters (0-35m). This decreasing trend represents a departure from the previous increasing trend that scientists documented in surface waters in the Strait of Georgia from 2000-2009.
35-105 Meters
The downward slope of the red line in the first chart shows a decreasing trend for dissolved oxygen in intermediate waters in the Strait of Georgia. This is consistent with the decreasing trend found in Puget Sound at the same depth (35-105m). This decreasing trend is also consistent with the decreasing trend that was recorded in intermediate waters in the Strait of Georgia from 2000-2009.
105 Meters to Bottom
The downward slope of the red line in the first chart reflects a decreasing trend for dissolved oxygen in deeper waters in the Strait of Georgia. This is consistent with the decreasing trend found in Puget Sound in deeper waters. This decreasing trend is also consistent with the decreasing trend that was documented in deeper waters in the Strait of Georgia from 2000-2009.
Seasonal Dissolved Oxygen Figures from the Strait of Georgia
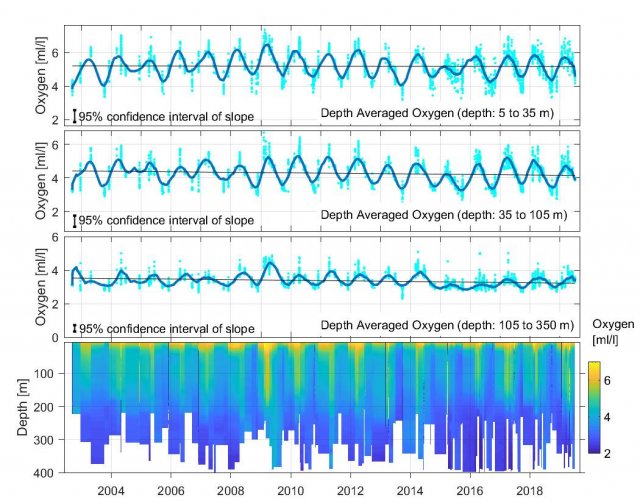
The figure below shows seasonal trends of average dissolved oxygen concentration in the Strait of Georgia over a longer time series, from 2002-2019. Consistent with previous figures, there is a clear declining trend in dissolved oxygen in each depth profile in the figure below (thin black line). There are also clear seasonal differences in levels of dissolved oxygen (thick blue line) which have an important influence on the Strait of Georgia. The last panel in this figure shows a visual representation of dissolved oxygen throughout the entire depth profile. High dissolved oxygen (yellow) is noticeable in the surface layer, and lower dissolved oxygen (blue) is noticeable at depth. Note: While approximately the same established depth intervals as in the previous figures, there are two minor differences: the surface layer in this figure starts at 5m (rather than 0m), and the deepest layer in this figure ends at 350m (rather than ‘bottom’).
Microplastics: An Emerging Threat to Marine Water Quality
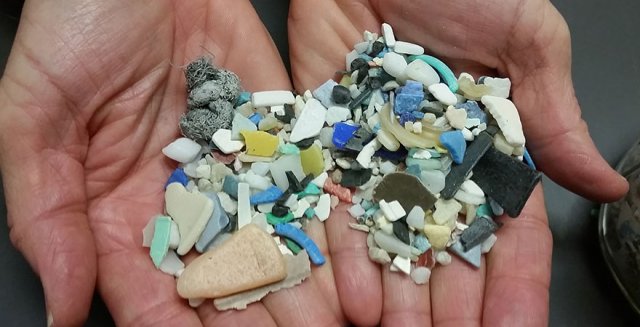
Microplastics are found throughout the Salish Sea, but “surprisingly little is known about the sources of these particles,” report Canadian scientists who presented their findings in Spring 2018 at the Salish Sea Ecosystem Conference in Seattle. Now the group, led by Dr. Peter Ross at the Vancouver Aquarium, is working to categorize the types of microplastics being found in the world’s oceans with the hope of identifying their origins and stopping the problem at its source.
Microplastics are entering the Salish Sea by several means including particles from tire wear on all of the region’s roads, coastal waterways, and wastewater treatment plant outfalls. Many wastewater treatment plants throughout the Salish Sea are currently upgrading to secondary and tertiary wastewater treatment methods, which will help filter out microplastics and improve marine water quality. As well, research is ongoing in order to increase our understanding of the impacts, distribution, and sources of microplastics in the Salish Sea.
Why is it Important?
Fish, crabs, and other marine animals need oxygen to survive. As oxygen levels decrease, these animals respond by changing their behavior to maintain their oxygen intake, such as moving to areas with greater oxygen levels, feeding less, and swimming less.
Studies have shown that fish living under reduced oxygen levels have less resistance to disease and lower reproduction rates. If oxygen levels get too low, fish and other animals may die - sometimes resulting in widespread "fish kills.”
Increased nutrient loads are impacting the water quality and habitats in many inlets and bays where forage fish and juvenile salmon spawn and rear, and where reproductive adult salmon gather before moving into watersheds to spawn. There is also an emerging understanding of how increasing nitrogen in marine waters is affecting the quality of the marine food web, changing the composition and timing of algae blooms, and working against efforts to restore eelgrass and kelp habitats. Some of these other eutrophication indicators are included in the Puget Sound Vital Signs.
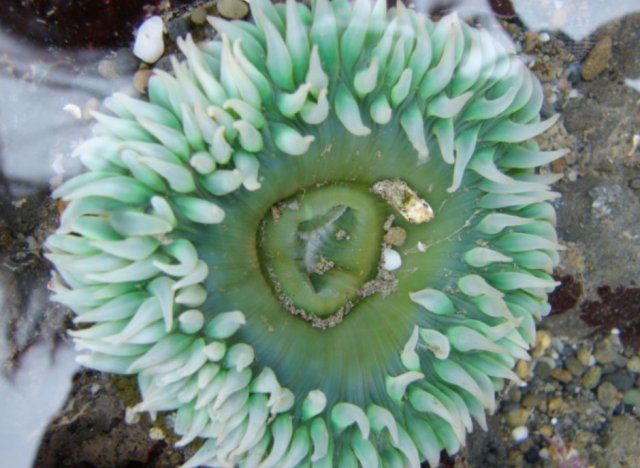
Reduced growth, slowed development, decreased reproductive abilities, deformities, and mortality (death) are among the most-extreme impacts from low dissolved oxygen (hypoxia). Hypoxic conditions can also contribute to habitat compression and chronic stress in affected marine species. An animal's mobility and its ability to regulate its respiration influence how much low dissolved oxygen conditions will affect it. Species that cannot tolerate low oxygen will either die or move to other areas, while species that can tolerate these conditions will thrive - thus affecting the makeup of the biological community. Immobile organisms such as molluscs and anemones are at a very high risk to negative health impacts and mortality since they cannot simply move to a new area with higher oxygen levels.
Low dissolved oxygen may also make marine animals more susceptible to impacts from toxic substances. This may be because low dissolved oxygen levels cause them to pass more water through their gills and this increases the amount of pollution absorbed in their bodies. This has implications for the overall marine food web.
Sustained Hypoxia in Saanich Inlet
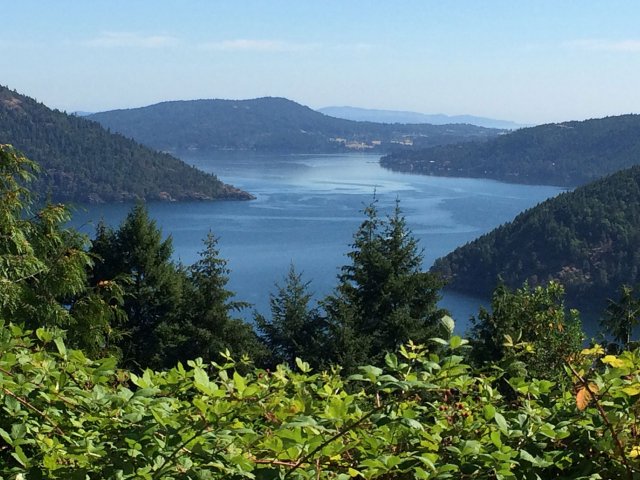
From 2015-2017, Saanich Inlet experienced a period of sustained hypoxia when typical levels of dissolved oxygen were not replenished, resulting in shifts in the distribution and quantity of several marine species. Species that could withstand low-oxygen conditions such as the slender sole, and those that had the ability to relocate such as the squat lobster, did not experience negative impacts during the low-oxygen period. However, immobile species such as the sea whip, and hypoxia-sensitive species such as the spot prawn experienced population declines. Spot prawns were completely absent from Saanich Inlet in 2016 but have since returned in lower numbers. Sea whip populations were at their lowest-recorded levels in 2018 since surveying began in 2006.
During this low-oxygen period, ‘new’ species established themselves in Saanich Inlet as well. One species that had only been recorded a handful of times in all past surveys, the striped nudibranch, and one species that had never before been recorded in the inlet, the white sea cucumber, first appeared in 2016 and remain in the inlet according to the 2018 survey. The striped nudibranch eats the sea whip, and competes with the spot prawns for food, which adds an additional threat to this already stressed community. It appears that dissolved oxygen levels in the Saanich Inlet are now slowly recovering, and an ocean research group, Ocean Networks Canada, conducts continued monitoring in the inlet.
Why is it Happening?
Oxygen levels are generally highest in surface waters. This is because:
- There is a significant amount of oxygen exchange between the water and the air above the water.
- In waters closer to the surface, light can penetrate to allow photosynthesis to occur, and this process generates oxygen.
Oxygen levels are lowest in areas where:
- Mixing of surface and deeper waters is restricted (such as deep channels and fjords).
- Little sunlight is available.
- Organic matter from natural and human-made sources is abundant (such as discharges from wastewater treatment plants and septic systems, and stormwater runoff).
Oxygen levels are currently declining in oceans and coastal waters around the world in part due to climate change. Sea surface temperatures are rising and warmer surface water absorbs oxygen less easily, and restricts natural mixing with deeper, colder waters.
Warmer water also encourages the growth of phytoplankton, which use up oxygen in deep water, as they sink and are consumed by bacteria.
The Role of Increased Nutrients
Nitrate is an important plant nutrient, but too much nitrate can cause algae "blooms" which use up oxygen.
Nitrate enters the Salish Sea from three sources:
- Natural sources from the Pacific Ocean.
- Point and non-point human sources of nutrients.
- Local watersheds.
In many parts of the Salish Sea, low dissolved oxygen is due to natural causes. Deep water is colder and less salty than surface water. This difference causes the natural mixing process to slow down, and less oxygen is carried from the surface to deeper areas. For example, the deep waters off the coast that enter the Salish Sea through the Strait of Juan de Fuca are naturally low in dissolved oxygen. In addition, the fjord-like underwater topography (bathymetry) in some parts of the Salish Sea restricts circulation and flushing that would otherwise replenish oxygen in those deep waters. Upwelling from the Pacific Ocean, and ocean boundary conditions influence marine water quality too. Higher rates of upwelling bring nutrient-rich but oxygen-poor water closer to the coast, which contributes to hypoxic conditions.
For the last 70 years, nutrient pollution from local rivers, agricultural runoff, and nearly 100 wastewater sources have entered the Salish Sea. These nutrients have contributed to increases in algae blooms during the spring and summer, which, in turn, has led to an increase in seasonal hypoxic areas in the Salish Sea. There is concern that nutrient pollution will increase in the future due to regional population growth, and that ocean acidification and increased sea surface temperature will exacerbate the impacts from this pollution.
Ocean Acidification in the Salish Sea
Ocean acidification has recently become an immediate and rapidly-increasing threat to many sensitive areas in the Salish Sea. Ocean acidification is the gradual increase in acidity in the world’s oceans because of their uptake of carbon dioxide (CO2) from the atmosphere. Scientists estimate that the oceans have absorbed approximately 1/3 of human-produced carbon dioxide over the last 250 years and this has led to a 30% increase in acidity.
While ocean acidification is a global problem driven by the global increase in atmospheric CO2, regional factors have the potential to exacerbate acidification in coastal areas. Coastal oceans are affected directly not only from local emissions of CO2 and other greenhouse gases but also from freshwater sources. For instance, nutrients and organic carbon from land runoff can lead to an enhanced cycle of algae-growth/algae-mortality. The increase in photosynthesizing algae intensifies oxygen production and CO2 consumption in surface coastal waters during the day, but the same algae produce CO2 during respiration at night. Moreover, as algae die and sink, bacteria decompose the additional organic matter that reaches the sea floor, which can sometimes generate hypoxic conditions.
The Salish Sea is naturally slightly more acidic than other waters, mainly due to high rates of nutrient upwelling, so even small changes in pH can pose a risk to marine animals in the region.
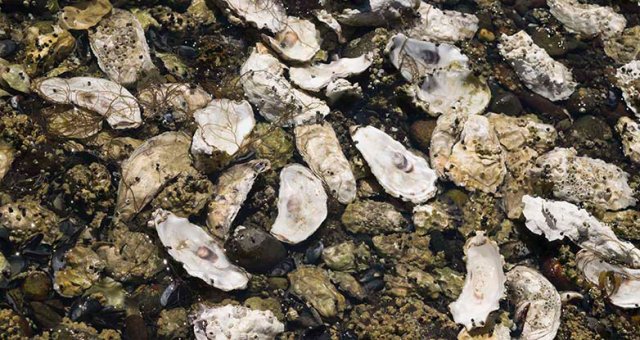
The impact of ocean acidification on shellfish has real economic consequences. Washington State’s shellfish industry is worth $270 million, and BC’s shellfish industry is worth $53.3 million, but these industries have been struggling since 2005 when Washington State first recorded massive die-offs of shellfish larvae due to ocean acidification. The jobs and livelihoods of employees in these industries are now increasingly at stake.
Ocean acidification also has cultural consequences. Harvesting shellfish has been a tradition in several coastal Indigenous communities since time immemorial but as ocean acidity increases and access to shellfish decreases, the flow of knowledge from elders to youth becomes disrupted.
In 2013, the Governor’s Marine Resources Advisory Council formed in Washington State to address the threat of ocean acidification. The Washington State Legislature has since invested nearly $10 million in ocean acidification research, monitoring, and modelling in support of the council. This has enabled the shellfish industry to begin to adapt their practices to increase shellfish survival, and has prompted upgrades to wastewater treatment plants, which will reduce local nutrient inputs that contribute to acidification.
What's Being Done About It?
Governments are taking actions such as developing farm waste management regulations, upgrading wastewater treatment facilities, and investing in ocean research and monitoring that will help improve dissolved oxygen levels and overall marine water quality in the Salish Sea.
Examples
Below are examples of projects and initiatives by federal, state and local governments that will help improve marine water quality conditions:
Canada and U.S. Initiatives
- In March 2020, a ban on plastic bags in Washington State was signed into law. The law will come into effect on January 1st 2021. A ban on single use plastics will be also be implemented in Canada as early as 2021. These efforts will help reduce the amount of microplastics in the ocean.
- In July 2017, the United States prohibited the manufacturing of personal care products that contain microplastic beads. Canada also began phasing out these products in July 2018 and a complete ban came into effect in July 2019.
- In 2018, Canada, along with several other countries, adopted the Ocean Plastics Charter, an agreement that aims to address the issue of marine plastic litter and to manage plastics in a more sustainable way.
- In November 2018, the Canadian federal, provincial, and territorial governments approved of the Canada-Wide Strategy on Zero Waste Plastic. The strategy aims to change the current life cycle of plastics and to support organizations that are working to reduce the amount of plastic waste they produce.
- In 2012, new Wastewater System Effluent Regulations came into effect in Canada that will reduce pollution from wastewater treatment plants and lead to improved water quality.
- Several academic institutions as well as many governmental and non-governmental organizations including the Washington Department of Ecology, Fisheries and Oceans Canada, and Ocean Networks Canada conduct ongoing research on marine water quality to help us better understand how marine conditions are changing in the Salish Sea:
Washington State and Local Government Initiatives
- The Puget Sound Partnership’s Action Agenda charts the course to protection and recovery of our nation’s largest estuary. It complements and incorporates the work of many partners from across Puget Sound and describes both regional implementation strategies and specific actions needed to meet recovery objectives, referred to as Puget Sound Vital Signs. The Puget Sound Partnership is currently developing the 2022-2026 Action Agenda and will integrate recommendations from the Marine Water Quality Implementation Strategy being lead by the Washington Department of Ecology which includes addressing known anthropogenic nutrient sources that contribute to depletions of dissolved oxygen; continuing to improve modeling tools and building more robust marine water quality monitoring and compliance datasets; and adaptively managing the Marine Water Quality Implementation Strategy as the region continues to grow and develop.
- Washington State Department of Ecology is also developing a Puget Sound Nutrient Reduction Plan Puget Sound Nutrient Source Reduction Project to address listed impaired waterbodies for low dissolved oxygen under their responsibilities under the Clean Water Act and the State Water Pollution Control Act to establish limits for point and nonpoint nutrient sources. Part of that plan includes developing a Nutrient General Permit for municipal domestic wastewater treatment plants. In addition, nonpoint source reductions are likely needed across all Puget Sound watersheds and collaboration and coordination with regional implementing organizations is needed to successfully achieve nonpoint source reductions.
- Washington's Dairy Nutrient Management Act requires 115 licensed cow dairies to develop nutrient management plans. Under these farm plans, many dairies apply the manure they generate to neighboring fields to fertilize feed crops, which means those crops require less commercial fertilizers.
- Constructing biodigesters to turn animal waste into a local source of energy prevents nutrients from entering waterways. Washington has several biodigesters now in operation.
- In 2017, the Marine Resources Advisory Council worked with ocean acidification experts to update Washington’s comprehensive strategy to address ocean acidification.
Province of British Columbia and Local Government Initiatives
- In 2019, Metro Vancouver Regional District began plans to implement a $2 billion dollar upgrade to the Iona Wastewater Treatment Plant that will upgrade the facility from primary treatment to secondary treatment by 2030. This upgrade will remove dissolved organic matter from the treated water and greatly improve the quality of water that the plant discharges.
- Upgrades to the Annacis Island Wastewater Treatment Plant in Delta, B.C. will also take place beginning in 2020. This upgrade will increase the ability of the plant to treat more wastewater and will repair and replace older parts of the plant.
- The Capital Regional District is currently building a $775 million dollar wastewater treatment facility to service the Greater Victoria Area on Vancouver Island, B.C. The facility is on track for completion by the end of 2020. This facility will provide tertiary treatment, one of the highest levels of treatment, to wastewater.
- In 2015, the District of Sechelt built the Sechelt Water Resource Centre to replace two aging wastewater treatment plants. The new facility provides tertiary treatment to wastewater.
- In North Vancouver and West Vancouver, construction is underway to build a $700 million dollar wastewater treatment plant in order to replace the current Lions Gate Wastewater Treatment Plant. The North Shore Wastewater Treatment Plant will be more energy efficient and will provide secondary treatment to wastewater.
Learn More
- Washington Dept. of Ecology marine water and sediment monitoring
- Puget Sound Ecosystem Monitoring Program Marine Waters Report
- Hood Canal Dissolved Oxygen Program
- Washington Dept. of Ecology "Eyes over Puget Sound" aerial surface water monitoring
- Puget Sound Partnership Vital Signs - Healthy Water Quality
- State of the Physical, Biological, and Selected Fishery Resources of Pacific Canadian Marine Ecosystems in 2018
- The Government of Canada Draft Science Assessment on Plastic Pollution
- OceanWise and Vancouver Aquarium Research Programs
Sustainable Perspective
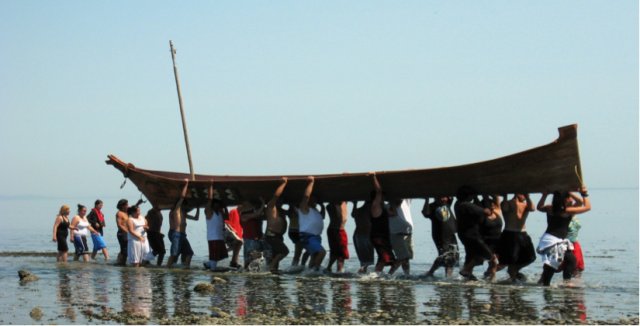
In 2008, a partnership developed between the Salish Canoe Journey and the U.S. Geological Survey to examine coastal waters of the Salish Sea by blending Western science and Coast Salish culture to study water quality and its effects on the ecosystem. Every year since 2008, canoe journey participants agreed to equip their canoes with water quality monitoring instruments to measure sea surface temperature, salinity, pH, dissolved oxygen, and turbidity simultaneously every ten seconds across 1,300 kilometers (over 800 miles) of the Salish Sea.
The Salish Sea Model
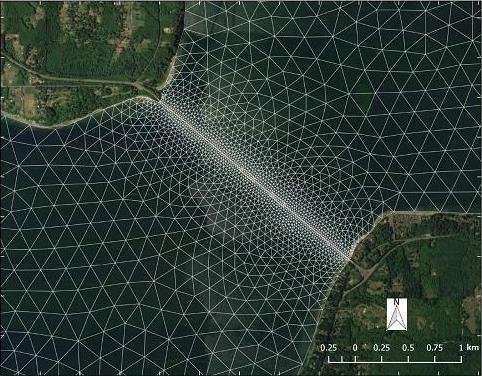
In addition to its capability of modeling basin-wide applications, the model has been used to design restoration actions near the mouth of the Stillaguamish River, and comprehensive basin-wide models of the Skagit River and Snohomish River estuaries for restoration activities around Whidbey Basin.
In the 2020 fiscal year, the SSM provided support to researchers from the University of Washington and the Washington State Department of Fish and Wildlife that are tracking pharmaceuticals such as opioids and the chemotherapy drug Melphalan—along with a suite of 62 other contaminants. The SSM was also used to compute a Salish Sea-wide map of effluent concentration from 99 wastewater outfalls over a one-year period to examine cumulative effects.
Seven Things You Can Do To Help
- Use beneficial landscaping techniques such as rain gardens, rain barrels, green roofs and permeable paving to help reduce the need for chemical fertilizers and reduce runoff into ditches and storm drains.
- Scoop your pet's poop. Pet waste is full of bacteria that can get washed into waterways and make people sick if they eat contaminated shellfish. Bag it and place it in the trash.
- If you are a boater, manage your sewage wastes properly. Do not discharge treated or untreated sewage into our waterways. Many marinas provide sewage pumpout as a free or low cost service.
- If you keep livestock, follow manure management practices. Contact your local conservation agency for technical assistance.
- If your home or business uses a septic system, take time to learn how your system works and keep it properly maintained. Ask for maintenance advice from your local health agency. Also, remember not to dispose of medication, chemicals, or garbage down your household toilet or sink, as these substances could end up in coastal waterways.
- Consider taking actions to minimize your use of single-use plastic products and reduce your release of microplastics in wash water by installing water-filtering devices to your washer.
- Reduce your carbon footprint. Higher levels of CO2 in the atmosphere contribute to climate change, which leads to higher water temperatures and higher levels of Co2 in the water, which leads to deoxygenation and ocean acidification.
References
Below is a listing of references used in this report.
- Albertson, S. L., J. Bos, G. Pelletier, and M. Roberts. 2007. Estuarine flow in the south basin of Puget Sound and its effects on near-bottom dissolved oxygen. WA Department of Ecology, Olympia, WA.
- Albertson, S. L., K. Erickson, J. A. Newton, G. Pelletier, R. A. Reynolds, and M. Roberts. 2002. South Puget Sound Water Quality Study Phase 1. WA Department of Ecology, Olympia, WA.
- Brandenberger, J.M., E.A. Crecelius, P. Louchouarn, S.R. Cooper, K. McDougall, E. Leopold, and G. Liu. 2008. Reconstructing trends in hypoxia using multiple paleoecological indicators recorded in sediment cores from Puget Sound, WA. National Oceanic and Atmospheric Administration, Pacific Northwest National Laboratory Report No. PNWD-4013.
- Canadian Council of Ministers of the Environment. 1999. Canadian Water Quality Guidelines for the Protection of Aquatic Life – Dissolved Oxygen (Marine). Winnipeg, Manitoba.
- Cope, B., and Roberts, M. 2013. Review and synthesis of available information to estimate human impacts to dissolved oxygen in Hood Canal. EPA and Washington Department of Ecology. EPA Publication No. 910-R-13-002. WDOE Publication No. 13-03-016. https://fortress.wa.gov/ecy/publications/SummaryPages/1303016.html.
- Crawford, W.R. & M.A. Peña (2013): Declining Oxygen on the British Columbia Continental Shelf, Atmosphere-Ocean, DOI:10.1080/07055900.2012.753028.
- Diaz, R. J. and R. Rosenberg. 2008. Spreading dead zones and consequences for marine ecosystems. Science 321:926-929.
- Fisheries, & Oceans Canada. (2017, December 11). Monitoring Southern BC Coastal Waters. Retrieved from https://www.dfo-mpo.gc.ca/science/data-donnees/cotesud-southcoast/index-eng.html.
- Fisheries and Oceans Canada (2020). Institute of Ocean Sciences Data Archive. Ocean Sciences Division. Department of Fisheries and Oceans Canada. http://www.pac.dfo-mpo.gc.ca/science/oceans/data-donnees/index-eng.html. Data obtained from 2020-01-30 to 2020-03-20.
- Gasbarro, R., Chu, J. W. F., & Tunnicliffe, V. (2019, June 1). Disassembly of an epibenthic assemblage in a sustained severely hypoxic event in a northeast Pacific basin.
- Gilbert, D. N. N. Rabalais, R. J. Diaz and J. Zhang. 2010. Evidence for greater oxygen decline rates in the coastal ocean than in the open ocean. Biogeosciences. 7: 2283-2296.
- Khangaonkar, T., Long, W., Sackmann, B., Mohamedali, T., & Roberts, M. (2012, November). Puget Sound Dissolved Oxygen Modeling Study: Development of an Intermediate Scale Water Quality Model.
- Khangaonkar, T., Nugraha, A., Xu, W., & Balaguru, K. (2019, June 18). Salish Sea Response to Global Climate Change, Sea Level Rise, and Future Nutrient Loads
- Krembs, C. 2012. Marine Water Condition Index: Washington State Department of Ecology. Washington State Department of Ecology, Olympia, WA. Publication No. 12-03-013. https://fortress.wa.gov/ecy/publications/summarypages/1203013.html.
- Mohamedali, T., M. Roberts, B. Sackmann, A. Kolosseus 2011a. Puget Sound Dissolved Oxygen Model Nutrient Load Summary for 1999-2008. Washington State Department of Ecology, Olympia, WA. Publication No. 11-03-057. https://fortress.wa.gov/ecy/publications/summarypages/1103057.html.
- Newton, J. A., A. L. Thomson, L. B. Eisner, G. A. Hannach, and S. L. Albertson. 1995. Dissolved oxygen concentrations in Hood Canal: are conditions different than forty years ago? In Puget Sound Research Conference Proceedings 1995.
- NOAA OAR Special Report - Scientific Summary of Ocean Acidification in Washington State Marine Waters. November 2012. Contribution No. 3934 from NOAA/Pacific Marine Environmental Laboratory.
- Okey, T. A., Alidina, H., Lo, V. B., & Jessen, S. (2014, February 22). Effects of climate change on Canada's Pacific marine ecosystems: A summary of scientific knowledge.
- Parks Canada Agency, & Government of Canada. (2018, October 25). Microplastics: more than a drop in the ocean. Retrieved from https://www.pc.gc.ca/en/nature/science/conservation/plastique-plastic/microplastique-microplastic.
- Paulson, A. J., C. P. Konrad, L. M. Frans, M. Noble, C. Kendall, E. G. Josberger, R. L. Huffman, and T. D. Olsen. 2007. Freshwater and saline loads of dissolved inorganic nitrogen to Hood Cana and Lynch Cove, Washington. U.S. Geological Survey, Reston, VA.
- Palsson, W. A., R. E. Pacunski, T. R. Parra, and Beam.J. 2008. The effects of hypoxia on marine fish populations in Southern Hood Canal, Washington. American Fisheries Society Symposium 64:255-280.
- Puget Sound Restoration Fund. (2019). Ocean Acidification. Retrieved from https://restorationfund.org/programs/oceanacidification/.
- Roberts, M., J. Bos, and S. L. Albertson. 2008. South Puget Sound dissolved oxygen study interim data report. WA Department of Ecology, Olympia, WA.
- Roberts, M., Mohamedali, T., Sackmann, B., Khangaonkar, T., & Long, W. (2014). Dissolved Oxygen Model Scenarios for Puget Sound and the Straits: Impacts of Current and Future Nitrogen Sources and Climate Change through 2070 (Publication No. 14‐03‐007). Olympia, Washington: Washington State Department of Ecology.
- Ryan Kelly and Jenny Grote Stoutenburg. Center for Ocean Solutions Stanford University. July 2012. Washington State’s Legal and Policy Options for Combating Ocean Acidification in State Waters. A Report to the Washington State Blue Ribbon Panel on Ocean Acidification.
- Talloni-Alvarez, N.E., Sumaila, U. R., Billon, P. L., & Cheung, W. W. L. (2019, March 16). Climate change impact on Canada’s Pacific marine ecosystem: The current state of knowledge.
- Vadeboncoeur, N., MacLennan, A., Able, T., & Okey, T. (2018, March 29). Transboundary Climate Change Indicators for the Salish Sea.
- Washington Department of Ecology (2020). Environmental Information Management System (http://www.ecology.wa.gov/eim/). Study IDs: MarineWater and MarineWater-P. Study Name: Long-term marine water column monitoring 1999-present. Data obtained in March and April, 2020.

