Climate Change Impacts on Transportation
Overview
The U.S. transportation system is essential to moving people and goods. It includes:
- Infrastructure, such as airports, train stations, roads, bridges, pipelines, and bike trails.
- Vehicles, including cars, buses, trucks, trains, ships, and aircraft.
- People, including equipment operators, designers, builders, and transportation officials.
Although the nation’s transportation system is built to withstand weather, climate change may affect this system over time.1 The impacts will vary by region. However, impacts in one region can readily affect another. For example, bridge damage in one place can cause road congestion in another. Changing water levels in one area may affect shipping nationwide.2
-
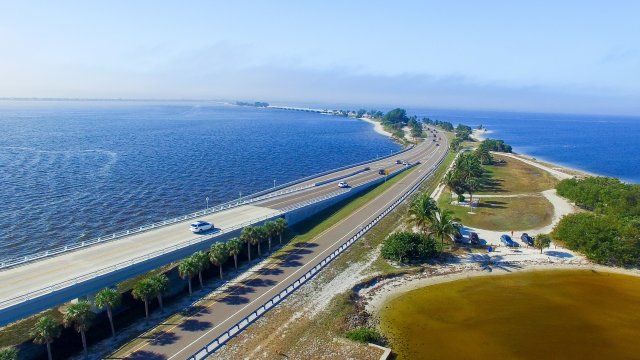
Damage to transportation systems. More than 60,000 miles of U.S. roads and bridges in coastal areas are at risk of flooding and damage from climate-change-related sea level rise.38
-
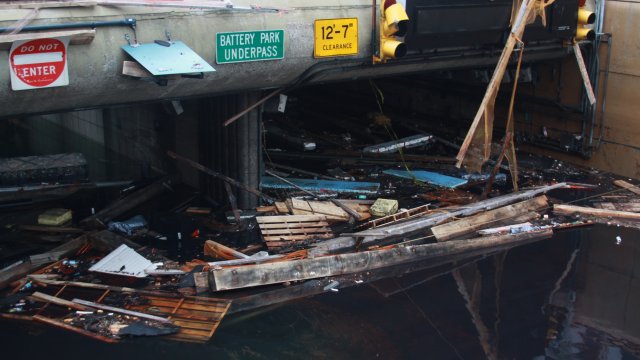
Disrupted mobility. The New York City metro area provided extra bus service after Superstorm Sandy to make up for flooded subway and commuter tunnels.39 As the climate changes, providing multiple modes of transit will be important.
-

Hazardous conditions. About 80% of the ground in Alaska has permafrost underneath it. Thawing permafrost from a warming climate could affect the roads and structures on top of it, leading to damage and accidents.40
-

Safety risks. As the climate changes, heat and other extreme weather can cause equipment issues, delays, passenger discomfort, and safety risks for travelers and workers.41
-

Economic impacts. Climate change can have pros and cons for U.S. shipyards, which supported around $40 billion in gross domestic product in 2019.42 For example, warmer weather might lengthen shipping seasons, but more intense rainfall could interrupt cargo movement.43
In addition, transportation interacts with and depends on other sectors of the economy, such as water resources and energy. Therefore, climate impacts on these sectors can also affect the transportation system.
Fortunately, communities can take many steps to help safeguard our transportation system. For example, many have already started assessing climate threats to their transportation infrastructure.3 Engineers are developing solutions to help bolster system resilience. Planners are taking into consideration climate data when they design, construct, and maintain transportation projects. Government agencies are supporting these efforts with funding and tools.4
Explore the sections on this page to learn more about climate change impacts on transportation:
- Top Climate Impacts on Transportation
- Transportation and the Economy
- Environmental Justice and Equity
- What We Can Do
- Related Resources
Top Climate Impacts on Transportation
Climate change may affect transportation at local, regional, and national scales. Three key impacts are described in this section.
1. Impacts on System Safety and Function

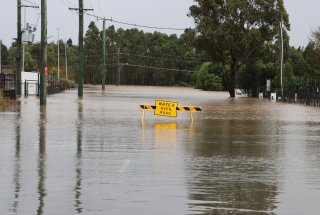
In many regions, sea level rise, changes in precipitation, extreme weather, and heat pose risks to the transportation system.5 These hazards may affect system performance, safety, and reliability.6 In coastal regions, rising sea levels and more extreme storms can lead to more storm surge and flooding, which can damage roads, bridges, railways, ports, and coastal airports.7 Increased local flooding can affect roadways and tunnels, weaken roadway materials, and cause traffic congestion. As a result, people may have trouble getting to their homes, schools, stores, and medical appointments.8
Across inland regions, heavy rains can cause flooding and landslides, affecting highways, railways, and bridges.9,10 Lack of rain can also be a concern. Drought combined with extreme heat increases wildfire risk.11 Wildfires can damage transportation networks and impair drivers’ visibility.
Rising temperatures can affect transportation in many regions. These impacts can be both immediate and long-lasting. For example, heat affects runways, and hotter air can make it more difficult for airplanes to take flight.12 Heat can also damage rail tracks and cause cracks in roads.13 In addition, heat can pose safety risks to transportation workers and travelers. For example, vehicles can overheat and roadway joints can buckle, leading to accidents.14
Warmer temperatures can also cause permafrost to thaw. Permafrost currently supports roads, airport runways, pipelines, and railroads in Alaska. Thawing permafrost can weaken this critical infrastructure.15
2. System Costs and the Economy
Climate change can have both positive and negative impacts on transportation system costs. For example, milder winters in some regions could cut the costs of winter road maintenance.17 However, other areas may see more damage to roads, bridges, and transit systems from heat, weather, and rising sea levels. As a result, costs to maintain, repair, and replace infrastructure are likely to increase.18
Climate change impacts on transportation can also have wide economic effects. One positive impact is that warmer weather could lengthen the shipping season for some northern ports.19 Damage to the transportation system, however, can interrupt the supply chain at local, regional, and national levels.20
In some coastal areas, more flooding is occurring as the sea level rises.21 Urban areas where there is a lot of pavement or where sewer systems cannot handle intense rainfall also are prone to flooding. Flooding disrupts the movement of commuters, tourists, and freight.22 People also need reliable transportation to get to their jobs. Extreme weather can disrupt transit options and damage roads, keeping people from getting to work.23
3. Reduced Access to Social Services and Necessities
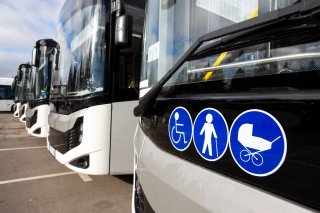
Climate-related impacts on the transportation system affects both urban and rural areas. For example, in urban areas, heavy rains can flood tunnels and underground rail stops, affecting residents’ ability to access critical services and necessities.24 However, people in cities may also have other transportation options, including walking.
In rural areas, there are typically fewer roads and transportation options than in cities. A single damaged road or bridge can cut off people’s access to services and necessities, such as food or medicine.25 Rural communities can also face rebuilding challenges, including being able to bring in construction materials.26
For more specific examples of climate change impacts in your region, please see the National Climate Assessment.
Transportation and the Economy
Transportation is critical to the nation’s economy. It links homes, workplaces, and communities. It supports tourism and provides a lifeline during emergencies. It also connects manufacturers with supplies and consumers with essential goods and products.
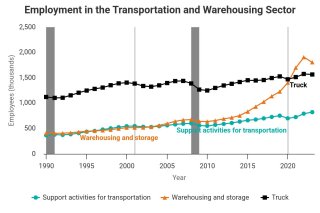
In 2023, the demand for transportation services contributed about $2.5 trillion to the U.S. gross domestic product.27 Also, in 2023, more than 16 million people worked in transportation or related industries, such as automotive manufacturing.28 The number of people employed in the transportation sector in 2023 represents 10.3% of the U.S. workforce.29
The costs of inaction are steep, especially if emissions continue to rise unabated and infrastructure is not adapted to the changing climate. This “business as usual” scenario is projected to cause hundreds of billions of dollars of damage per year by 2090.30 Further, climate change impacts on transportation infrastructure can disrupt the lives of the many people who use U.S. roads and bridges every day.
Environmental Justice and Equity
Some groups are particularly vulnerable to climate change impacts on transportation. For example, more than 18.6 million Americans have disabilities that make traveling outside their home difficult.31 People with disabilities are more likely to use public transit, so they can be greatly affected when these services are disrupted.32
Low-income households, older adults, and those who speak limited English often have fewer transportation options. Disruptions to these networks can further reduce access to services and resources, especially during emergencies.33 Studies anticipate that coastal flooding due to sea level rise will also disproportionately affect minority and low-income communities.34
Some rural and Indigenous communities also are at higher risk of climate-related transportation disruptions given their remote locations. For instance, detours caused by closed or damaged bridges are two times longer in rural areas than elsewhere.35 In remote communities, any impacts to the transportation system can affect people’s ability to access essential services.36 In Alaska, many Indigenous peoples are now even facing the possibility of relocation due to threats such as thawing permafrost, flooding, and erosion.37 These impacts threaten the existence of entire communities.
What We Can Do
Image source: Oregon Department of Transportation, CC BY 2.0
Municipal, state, and national leaders—as well as individuals—can reduce climate change’s impacts on transportation in many ways, including the following:
- Build resilience. Communities and transportation agencies can assess risks to their transportation systems, consider solutions, and take action.
- Support smart transportation options. The way we develop our communities can make our streets safer, protect our green spaces, and give people more transportation options.
- Report damage. Report road, bridge, or other transportation damages or hazards you notice to your local department of transportation.
- Get to know your neighbors. If possible, help your at-risk neighbors access resources and safe transportation in an emergency.
- Reduce your carbon footprint. Driving energy-efficient vehicles, carpooling, and other strategies can help reduce emissions that contribute to climate change.
- Plan ahead for business disruptions. Identify ways to protect your supply chains from climate risks, to help ensure the movement of critical goods and products. Consider joining other companies, such as some SmartWay partners, doing the same type of contingency planning.
See additional actions you can take, as well as steps that companies can take, on EPA’s What You Can Do About Climate Change page.
Related Resources
- Fifth National Climate Assessment, Chapter 13: “Transportation.”
- Transportation, Air Pollution, and Climate Change. Describes programs and actions people can take to reduce the impacts of transportation on air quality and climate change.
- U.S. Department of Transportation (DOT). The lead federal agency for building and maintaining U.S. transportation systems. Provides grants to ensure a safe and reliable transportation system.
- DOT, Federal Highway Administration. Supports state and local governments in designing, building, and maintaining highways.
- Transportation Research Board: Climate Change. Provides leadership in transportation improvements and innovation, including enhancing resilience against climate change.
- Federal Transit Administration grants. Help local public transit systems improve public transportation.
Endnotes
1 Liban, C.B., R. Kafalenos, L. Alessa, S. Anenberg, M. Chester, J. DeFlorio, F.J. Dóñez, A. Flannery, M.R. Sanio, B.A. Scott, and A.M.K. Stoner, 2023: Ch. 13. Transportation. In: Fifth National Climate Assessment. Crimmins, A.R., C.W. Avery, D.R. Easterling, K.E. Kunkel, B.C. Stewart, and T.K. Maycock, Eds. U.S. Global Change Research Program, Washington, DC, USA. https://doi.org/10.7930/NCA5.2023.CH13, p. 13-5.
2 Jacobs, J.M., M. Culp, L. Cattaneo, P. Chinowsky, A. Choate, S. DesRoches, S. Douglass, and R. Miller, 2018: Transportation. In Impacts, Risks, and Adaptation in the United States: Fourth National Climate Assessment, Volume II [Reidmiller, D.R., C.W. Avery, D.R. Easterling, K.E. Kunkel, K.L.M. Lewis, T.K. Maycock, and B.C. Stewart (eds.)]. U.S. Global Change Research Program, Washington, DC, USA, pp. 479–511. doi: 10.7930/NCA4.2018.CH12, p. 485.
3 Liban, C. B., et al. (2023). Ch. 13: Transportation. Fifth National Climate Assessment. U.S. Global Change Research Program, Washington, DC, p. 13-7.
4 Jacobs, J.M., et al. (2018). Ch. 12: Transportation. In: Impacts, risks, and adaptation in the United States: Fourth national climate assessment, volume II. U.S. Global Change Research Program, Washington, DC, p. 492.
5 Liban, C. B., et al. (2023). Ch. 13: Transportation. Fifth National Climate Assessment. U.S. Global Change Research Program, Washington, DC, p. 13-8.
6 Liban, C. B., et al. (2023). Ch. 13: Transportation. Fifth National Climate Assessment. U.S. Global Change Research Program, Washington, DC, p. 13-8.
7 Liban, C. B., et al. (2023). Ch. 13: Transportation. Fifth National Climate Assessment. U.S. Global Change Research Program, Washington, DC, p. 13-8.
8 Jacobs, J.M., et al. (2018). Ch. 12: Transportation. In: Impacts, risks, and adaptation in the United States: Fourth national climate assessment, volume II. U.S. Global Change Research Program, Washington, DC, p. 487.
9 Liban, C. B., et al. (2023). Ch. 13: Transportation. Fifth National Climate Assessment. U.S. Global Change Research Program, Washington, DC, p. 13-8.
10 Ready.gov. (2021). Floods. Retrieved 12/31/2024.
11Liban, C. B., et al. (2023). Ch. 13: Transportation. Fifth National Climate Assessment. U.S. Global Change Research Program, Washington, DC, p. 13-8.
12 Jacobs, J.M., et al. (2018). Ch. 12: Transportation. In: Impacts, risks, and adaptation in the United States: Fourth national climate assessment, volume II. U.S. Global Change Research Program, Washington, DC, p. 499.
13 Liban, C. B., et al. (2023). Ch. 13: Transportation. Fifth National Climate Assessment. U.S. Global Change Research Program, Washington, DC, p. 13-8.
14 Liban, C. B., et al. (2023). Ch. 13: Transportation. Fifth National Climate Assessment. U.S. Global Change Research Program, Washington, DC, p. 13-8.
15 Jacobs, J.M., et al. (2018). Ch. 12: Transportation. In: Impacts, risks, and adaptation in the United States: Fourth national climate assessment, volume II. U.S. Global Change Research Program, Washington, DC, p. 485.
16 Liban, C. B., et al. (2023). Ch. 13: Transportation. Fifth National Climate Assessment. U.S. Global Change Research Program, Washington, DC, p. 13-8.
17 Jacobs, J.M., et al. (2018). Ch. 12: Transportation. In: Impacts, risks, and adaptation in the United States: Fourth national climate assessment, volume II. U.S. Global Change Research Program, Washington, DC, p. 485.
18 Jacobs, J.M., et al. (2018). Ch. 12: Transportation. In: Impacts, risks, and adaptation in the United States: Fourth national climate assessment, volume II. U.S. Global Change Research Program, Washington, DC, p. 483–485.
19 Jacobs, J.M., et al. (2018). Ch. 12: Transportation. In: Impacts, risks, and adaptation in the United States: Fourth national climate assessment, volume II. U.S. Global Change Research Program, Washington, DC, p. 489.
20 Jacobs, J.M., et al. (2018). Ch. 12: Transportation. In: Impacts, risks, and adaptation in the United States: Fourth national climate assessment, volume II. U.S. Global Change Research Program, Washington, DC, p. 485.
21 National Oceanic and Atmospheric Administration. (2022). The state of high tide flooding and annual outlook. Retrieved 3/16/2022.
22 Jacobs, J.M., et al. (2018). Ch. 12: Transportation. In: Impacts, risks, and adaptation in the United States: Fourth national climate assessment, volume II. U.S. Global Change Research Program, Washington, DC, p. 490.
23 Jacobs, J.M., et al. (2018). Ch. 12: Transportation. In: Impacts, risks, and adaptation in the United States: Fourth national climate assessment, volume II. U.S. Global Change Research Program, Washington, DC, p. 491.
24 Jacobs, J.M., et al. (2018). Ch. 12: Transportation. In: Impacts, risks, and adaptation in the United States: Fourth national climate assessment, volume II. U.S. Global Change Research Program, Washington, DC, p. 490.
25 Jacobs, J.M., et al. (2018). Ch. 12: Transportation. In: Impacts, risks, and adaptation in the United States: Fourth national climate assessment, volume II. U.S. Global Change Research Program, Washington, DC, p. 491.
26 J.M., et al. (2018). Ch. 12: Transportation. In: Impacts, risks, and adaptation in the United States: Fourth national climate assessment, volume II. U.S. Global Change Research Program, Washington, DC, p. 491.
27 U.S. Department of Transportation (DOT), Bureau of Transportation Statistics (BTS). (N.D.). Contribution of transportation to the economy: Final demand attributed to transportation. Retrieved 12/31/2024 from https://data.bts.gov/stories/s/pgc3-e7j9/
28 U.S. Department of Transportation (DOT), Bureau of Transportation Statistics (BTS). (N.D.). Employment in transportation: Employment in transportation and related industries. Retrieved 12/31/2024 from https://data.bts.gov/stories/s/caxh-t8jd
29 U.S. Department of Transportation (DOT), Bureau of Transportation Statistics (BTS). (N.D.). Employment in transportation: Employment in transportation and related industries. Retrieved 12/31/2024 from https://data.bts.gov/stories/s/caxh-t8jd
30 Neumann, J.E., et al. (2021). Climate effects on US infrastructure: the economics of adaptation for rail, roads, and coastal development. Climate Change, 167, 44. https://doi.org/10.1007/s10584-021-03179-w.
31 U.S. Department of Transportation (DOT), Bureau of Transportation Statistics (BTS) (2022). Travel patterns of American adults with disabilities. Retrieved 3/22/2022.
32 U.S. Department of Transportation (DOT), Bureau of Transportation Statistics (BTS) (2022). Travel patterns of American adults with disabilities. Retrieved 3/22/2022.
33 Jacobs, J.M., et al. (2018). Ch. 12: Transportation. In: Impacts, risks, and adaptation in the United States: Fourth national climate assessment, volume II. U.S. Global Change Research Program, Washington, DC, p. 491.
34 EPA. (2021). Climate change and social vulnerability in the United States: A focus on six impacts. EPA 430-R-21-003, pp. 45-54.
35 DOT BTS. (2021). Rural transportation statistics. Retrieved 1/26/2022.
36 Jantarasami, L.C., et al. (2018). Ch. 15: Tribes and Indigenous peoples. In: Impacts, risks, and adaptation in the United States: Fourth national climate assessment, volume II. U.S. Global Change Research Program, Washington, DC, p. 580.
37 Jacobs, J.M., et al. (2018). Ch. 12: Transportation. In: Impacts, risks, and adaptation in the United States: Fourth national climate assessment, volume II. U.S. Global Change Research Program, Washington, DC, p. 485.
38 Jacobs, J.M., et al. (2018). Ch. 12: Transportation. In: Impacts, risks, and adaptation in the United States: Fourth national climate assessment, volume II. U.S. Global Change Research Program, Washington, DC, p. 486.
39 Jacobs, J.M., et al. (2018). Ch. 12: Transportation. In: Impacts, risks, and adaptation in the United States: Fourth national climate assessment, volume II. U.S. Global Change Research Program, Washington, DC, p. 490.
40 U.S. Environmental Protection Agency (EPA). (2021). Climate change indicators: Permafrost. Retrieved 3/22/2022.
41 Jacobs, J.M., et al. (2018). Ch. 12: Transportation. In: Impacts, risks, and adaptation in the United States: Fourth national climate assessment, volume II. U.S. Global Change Research Program, Washington, DC, p. 489.
42 DOT, Maritime Administration. (2021). Nation’s shipyards support $42.4 billion in gross domestic product. Retrieved 1/26/2022.
43 Jacobs, J.M., et al. (2018). Ch. 12: Transportation. In: Impacts, risks, and adaptation in the United States: Fourth national climate assessment, volume II. U.S. Global Change Research Program, Washington, DC, pp. 486, 497.


