Climate Change Indicators: Freeze-Thaw Conditions
This indicator tracks the number of days the U.S. and North American landscape is not frozen.
Key Points
- Within the contiguous 48 states, 2023 had 17 more unfrozen days than the long-term average (1979–2023). Six of the 10 least frozen years on record have all occurred within the last decade. The number of unfrozen days in the contiguous 48 states has increased at an average rate of about four days per decade (Figure 1).
- Alaska’s unfrozen days have increased at an average rate of about four days per decade (Figure 2). Eight of the 10 least frozen years on record in Alaska have all occurred within the last decade.
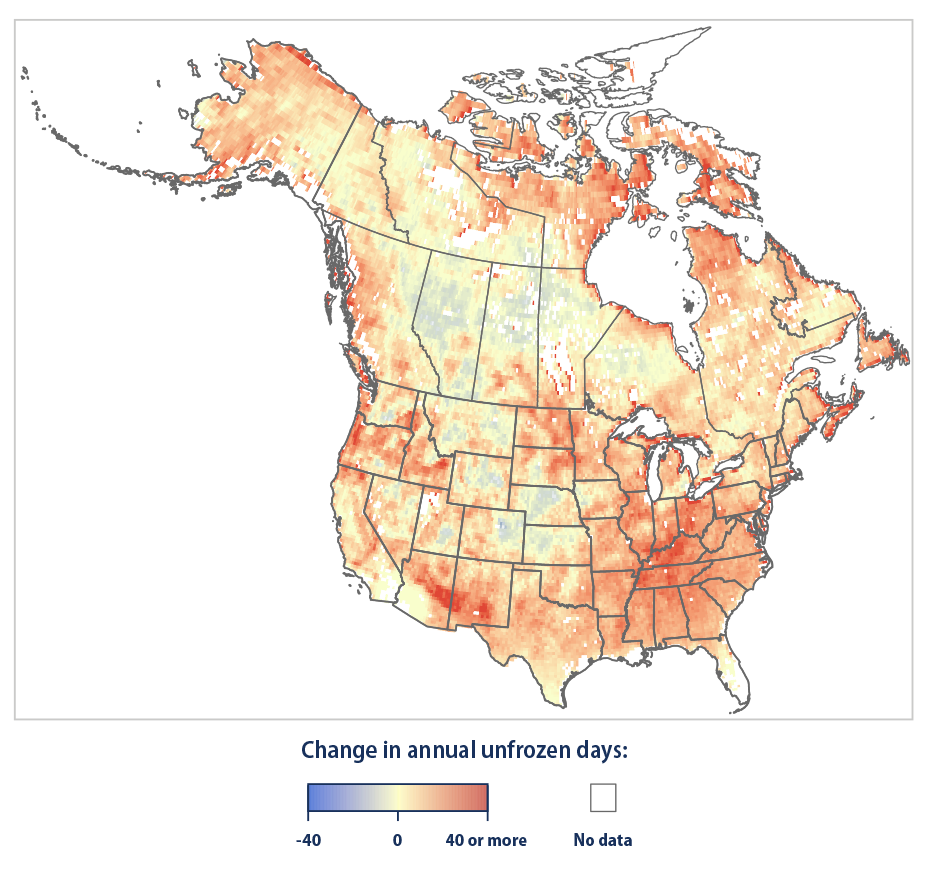
- Across North America, the number of unfrozen days in a year has increased since 1979, but trends vary widely with broad-scale regional patterns (Figure 3). Within the United States, the number of unfrozen days per year has increased the most in parts of the West, Mid-South, and North Central states. Parts of Alaska and northern Canada have also seen a sizable increase in unfrozen conditions. Conversely, some areas in the U.S. and Canadian interior have experienced a long-term increase in frozen conditions.
Background
The freezing point (32°F) is a critical temperature threshold for many aspects of life. The number and timing of days with temperatures below freezing affect ecosystems and many sectors of the economy. For example, many crops only grow during periods when they are not limited by frost damage.1
The number of days below freezing during a year determines which plants can thrive, what food sources are available for animals, and when and how animals migrate or hibernate. Freezing temperatures also help reduce populations of certain insects and other pests that can damage crops and forests or spread diseases to humans (see the Lyme Disease indicator, for example); conversely, a mild winter with fewer days of frost can lead to more of these pests during the following spring and summer.1 Temperatures below freezing also allow precipitation to fall as snow rather than rain (see the Snowfall indicator), which is important for regional water supplies and for places where winter activities, like skiing and snowmobiling, are an important part of the economy. Regional temperature conditions also drive the freezing and thawing of lakes and rivers (see Lake Ice and Ice Breakup in Three Alaskan Rivers, for example).2
As the Earth’s climate warms overall (see the U.S. and Global Temperature indicator), the number of days below freezing has decreased in most parts of the United States. Continued reduction in frozen days could lead to a variety of effects on ecosystems, drought, wildfire risk, agriculture, natural resources, and the economy.
About the Indicator
This indicator tracks the total number of unfrozen days per year in the contiguous 48 states and Alaska. Here, a “frozen day” is any day in which frozen conditions are present at ground level in both morning and evening. An “unfrozen day” is the opposite.
The indicator is based on satellite measurements that detect whether the land surface is frozen. For a broader perspective, it also shows results in a map for North America. It is complementary to EPA’s Length of Growing Season indicator, but rather than relying on temperature thresholds, it offers a unique perspective based on ecologically relevant physical changes from different data sources and calculations. This indicator focuses on whether the landscape itself is frozen (i.e., frozen conditions are present at ground level), and it counts all frozen or unfrozen days throughout the year. In contrast, the growing season indicator is based on air temperatures and it focuses on one continuous stretch of days between the last frost of spring and the first frost of fall.
This indicator was developed by dividing the country into a grid with thousands of cells, using satellite measurements to calculate the number of unfrozen days in each cell for every year, and then averaging all the grid cells together. Figures 1 and 2 show annual averages for the contiguous 48 states and Alaska, respectively. These graphs compare the number of unfrozen days per year against the 1979–2023 long-term average. Figure 3 shows how the annual average change for this period looks geographically. The calculations for this indicator include all land areas that experience freeze-thaw cycles that affect plant life—which means it does not cover areas that are permanently frozen, areas that never freeze, land with no plant life, or large bodies of water.
About the Data
Indicator Notes
At any given location, the number of days experiencing frozen conditions varies from year to year as a result of normal variation in weather patterns. With more than four decades of data, though, variability should not affect the conclusions that can be inferred from the long-term trends shown in this indicator.
A decline in frozen conditions does not necessarily lead to a corresponding increase in agricultural productivity. This is because plant productivity also depends on plant-specific temperature thresholds (some yields go down if temperatures get too warm), pollinators, and seasonal limitations in water and nutrient availability.4 Agricultural production also depends on management activities (e.g., choice of crop varieties suited to changing climate conditions, timing of planting, irrigation, pesticide and fertilizer applications) and natural weather events, such as storms.
This indicator differs from EPA’s Length of Growing Season indicator because it is based on satellite data rather than on-the-ground weather stations, and because it counts the total number of unfrozen days throughout the year—not just the stretch of consecutive days between the last spring frost and the first fall frost. Both indicators are useful for different reasons: growing season is especially meaningful for agricultural crops, while a broader look at frozen conditions is important for understanding ecological impacts, including biological and hydrological processes. In addition, the satellite method used here can pick up local variations in areas that might not have many long-term weather stations that measure air temperature. The two indicators show similar patterns, which is consistent with multiple lines of evidence pointing to similar conclusions about the nation’s changing climate.
Data Sources
Technical Documentation
References
1 IPCC (Intergovernmental Panel on Climate Change). (2022). Climate change 2022—Impacts, adaptation and vulnerability: Working Group II contribution to the Sixth Assessment Report of the Intergovernmental Panel on Climate Change (H.-O. Pörtner, D. C. Roberts, M. Tignor, E. S. Poloczanska, K. Mintenbeck, A. Alegría, M. Craig, S. Langsdorf, S. Löschke, V. Möller, A. Okem, & B. Rama, Eds.). Cambridge University Press. https://doi.org/10.1017/9781009325844
2 Kim, Y., Kimball, J. S., Glassy, J., & Du, J. (2017). An extended global Earth system data record on daily landscape freeze–thaw status determined from satellite passive microwave remote sensing. Earth System Science Data, 9(1), 133–147. https://doi.org/10.5194/essd-9-133-2017
3 Kim Y., & Kimball, J. (2024). Update to data originally published in Kim, Y., Kimball, J. S., Glassy, J., & Du, J. (2017). An extended global Earth system data record on daily landscape freeze–thaw status determined from satellite passive microwave remote sensing. Earth System Science Data, 9(1), 133–147.
4 USGCRP (U.S. Global Change Research Program). (2017). Climate science special report: Fourth National Climate Assessment (NCA4), volume I (D. J. Wuebbles, D. W. Fahey, K. A. Hibbard, D. J. Dokken, B. C. Stewart, & T. K. Maycock, Eds.). https://doi.org/10.7930/J0J964J6
5 Kim, Y., Kimball, J. S., Du., J., & Glassy, J. (2021). MEaSUREs global record of daily landscape freeze/thaw status, version 5 [Data set]. NASA National Snow and Ice Data Center. https://doi.org/10.5067/LJ6SLXNJB2CQ

